Reports that keep up with you.
Where's the gap?
A column against last year, traffic lights on every line, then why it changed.
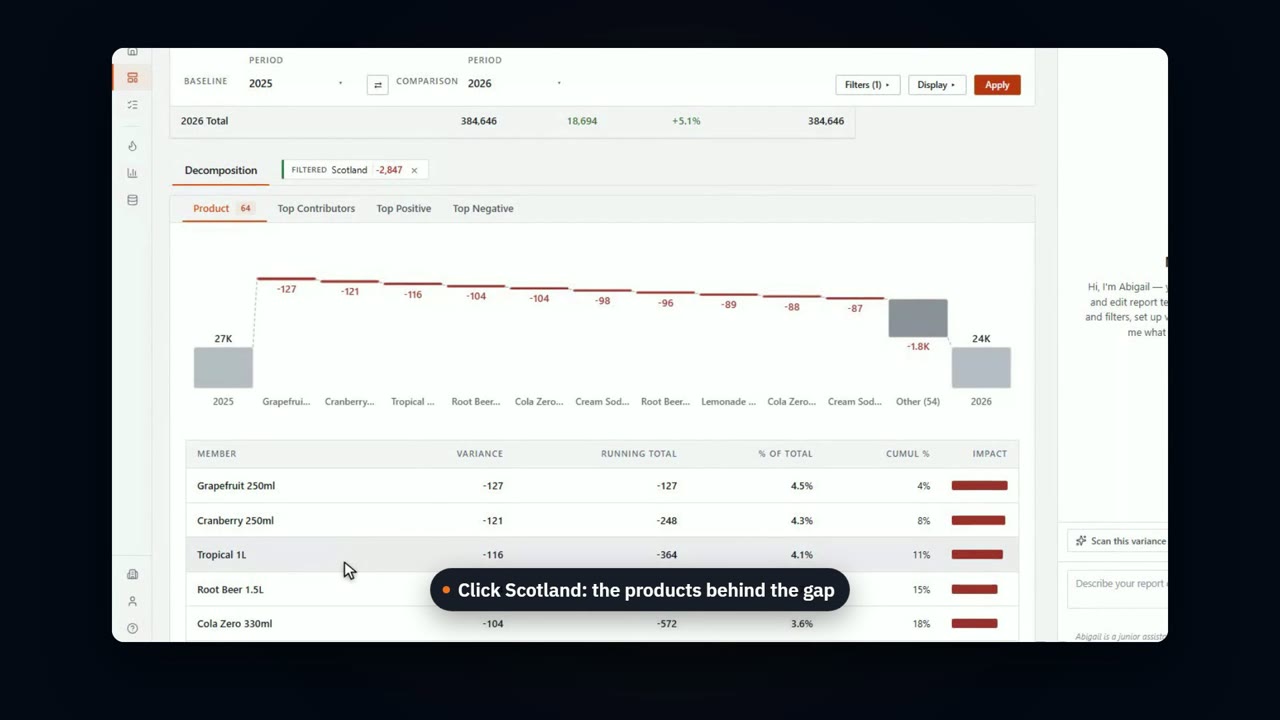
Where's the gap? A column against last year, traffic lights on every line, then why it changed.
A column against last year, traffic lights on every line, then why it changed.
Where's the gap? A column against last year, traffic lights on every line, then why it changed.
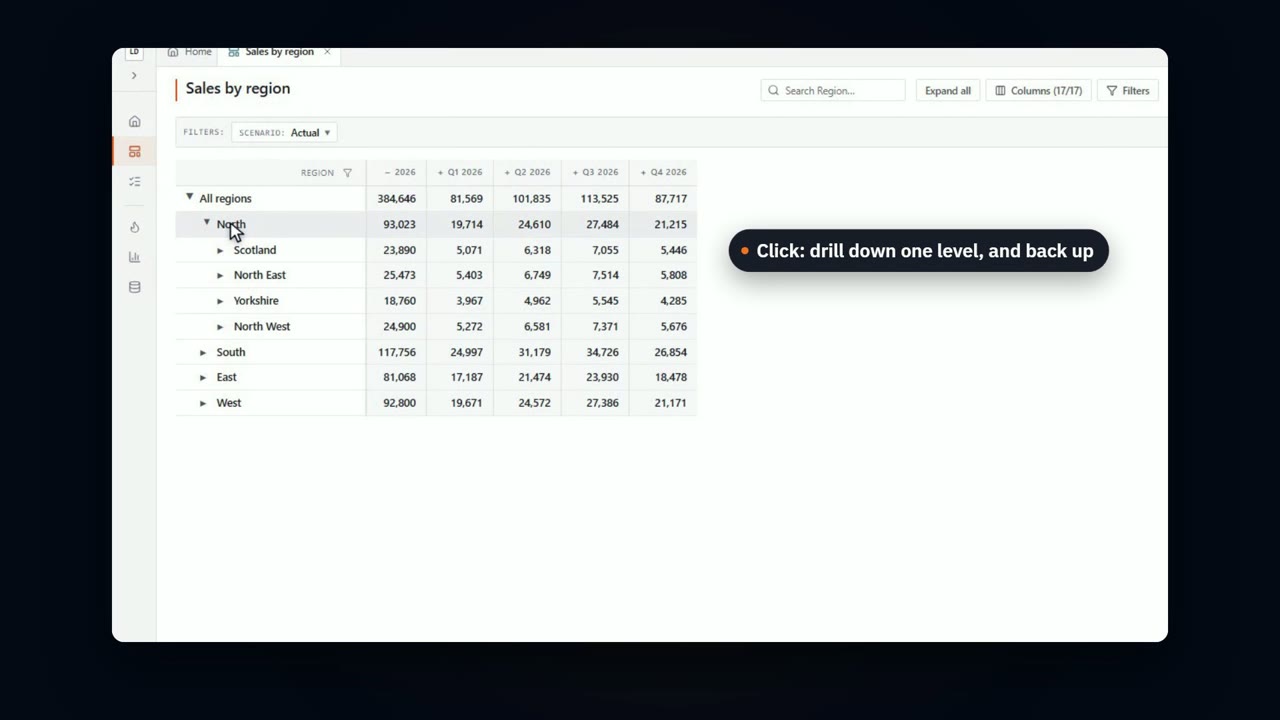
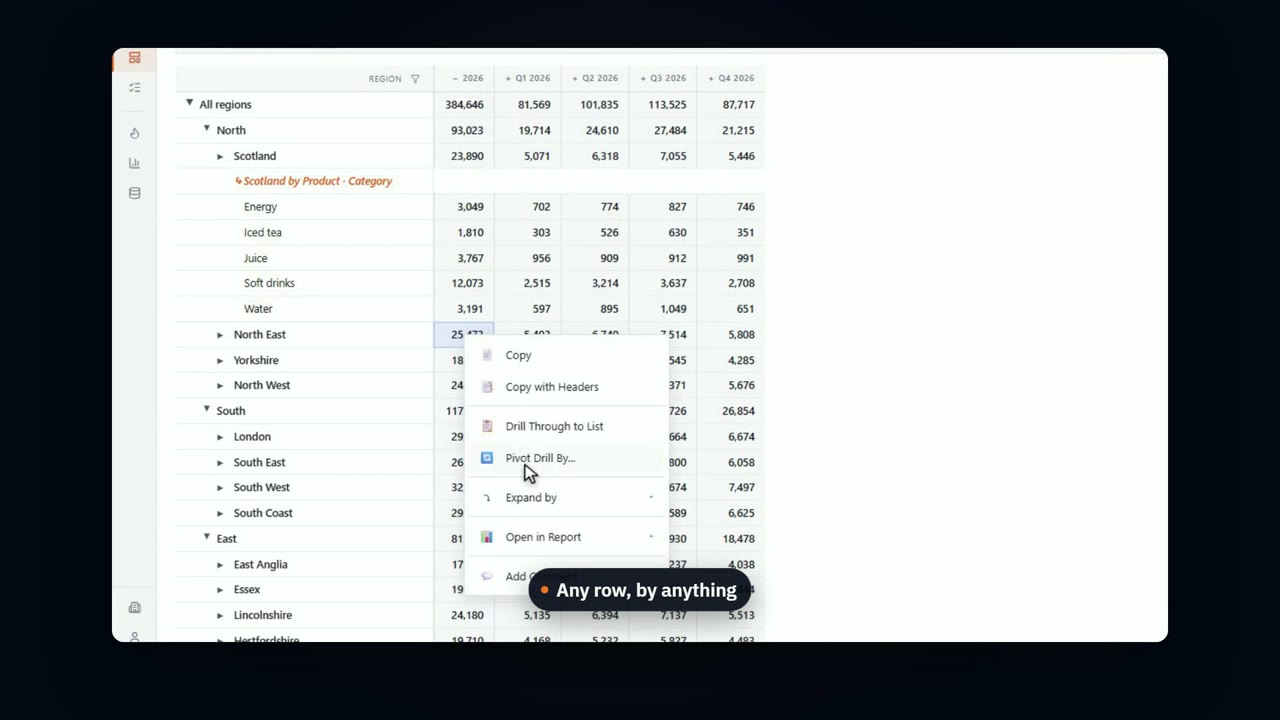
Down a region to the branch, across to the product, and back, on a production-sized report that reshapes as you go.
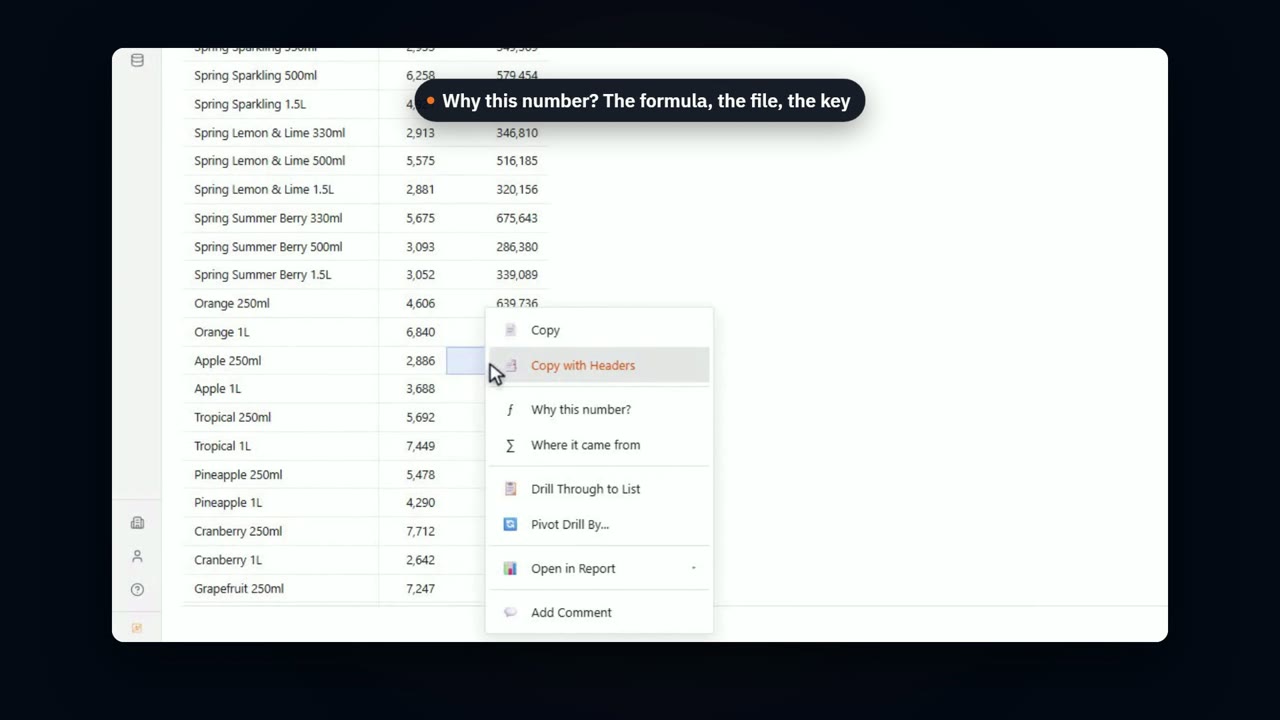
Build a calculated line with a lookup to a file, right in the report. Then ask why a number is what it is.
Book a demo and we'll run it on your data.