Where's the gap? A column against last year, traffic lights on every line, then why it changed.
A number moved and someone wants to know why. Compare any two versions, see which lines drove the change, and drill down until you reach the rows that caused it.
Where's the gap? A column against last year, traffic lights on every line, then why it changed.
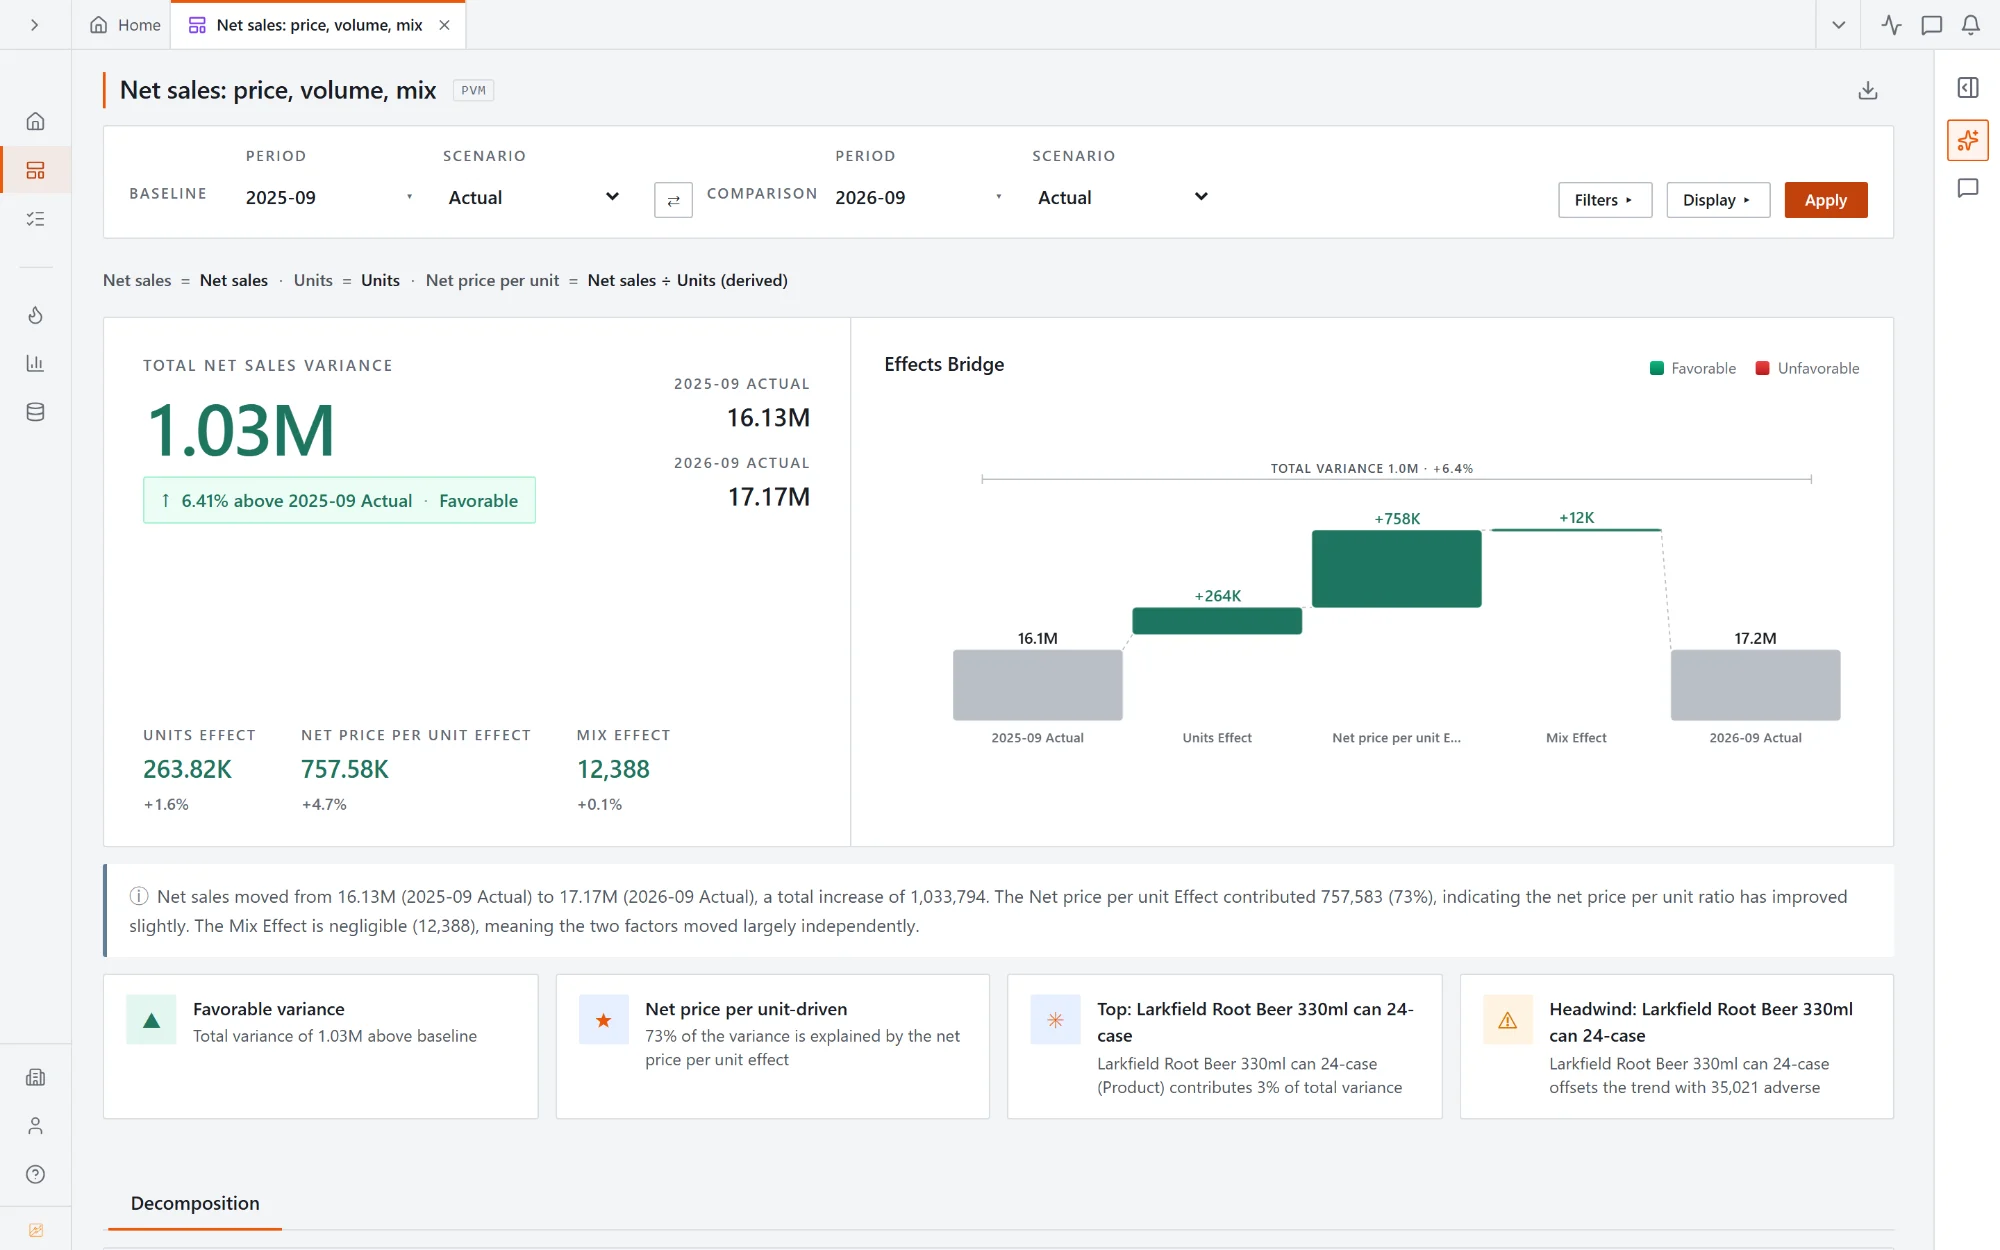
Pick two periods or two versions and the bridge splits the change into units, price and mix, with a written summary and the biggest movers underneath.
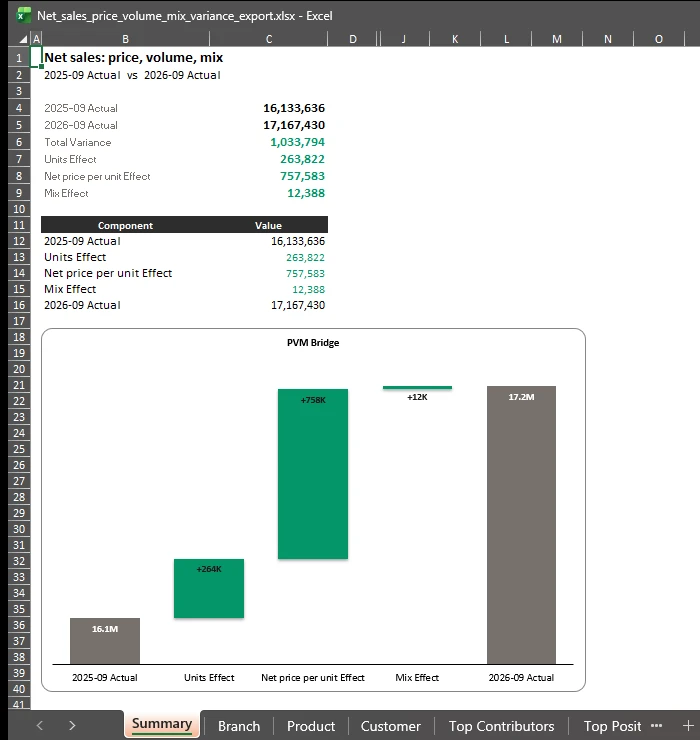
Export a variance and the workbook opens on a real Excel waterfall chart, every bar labelled, favourable steps green and adverse ones red. The figures sit above it, with a sheet for each breakdown behind.
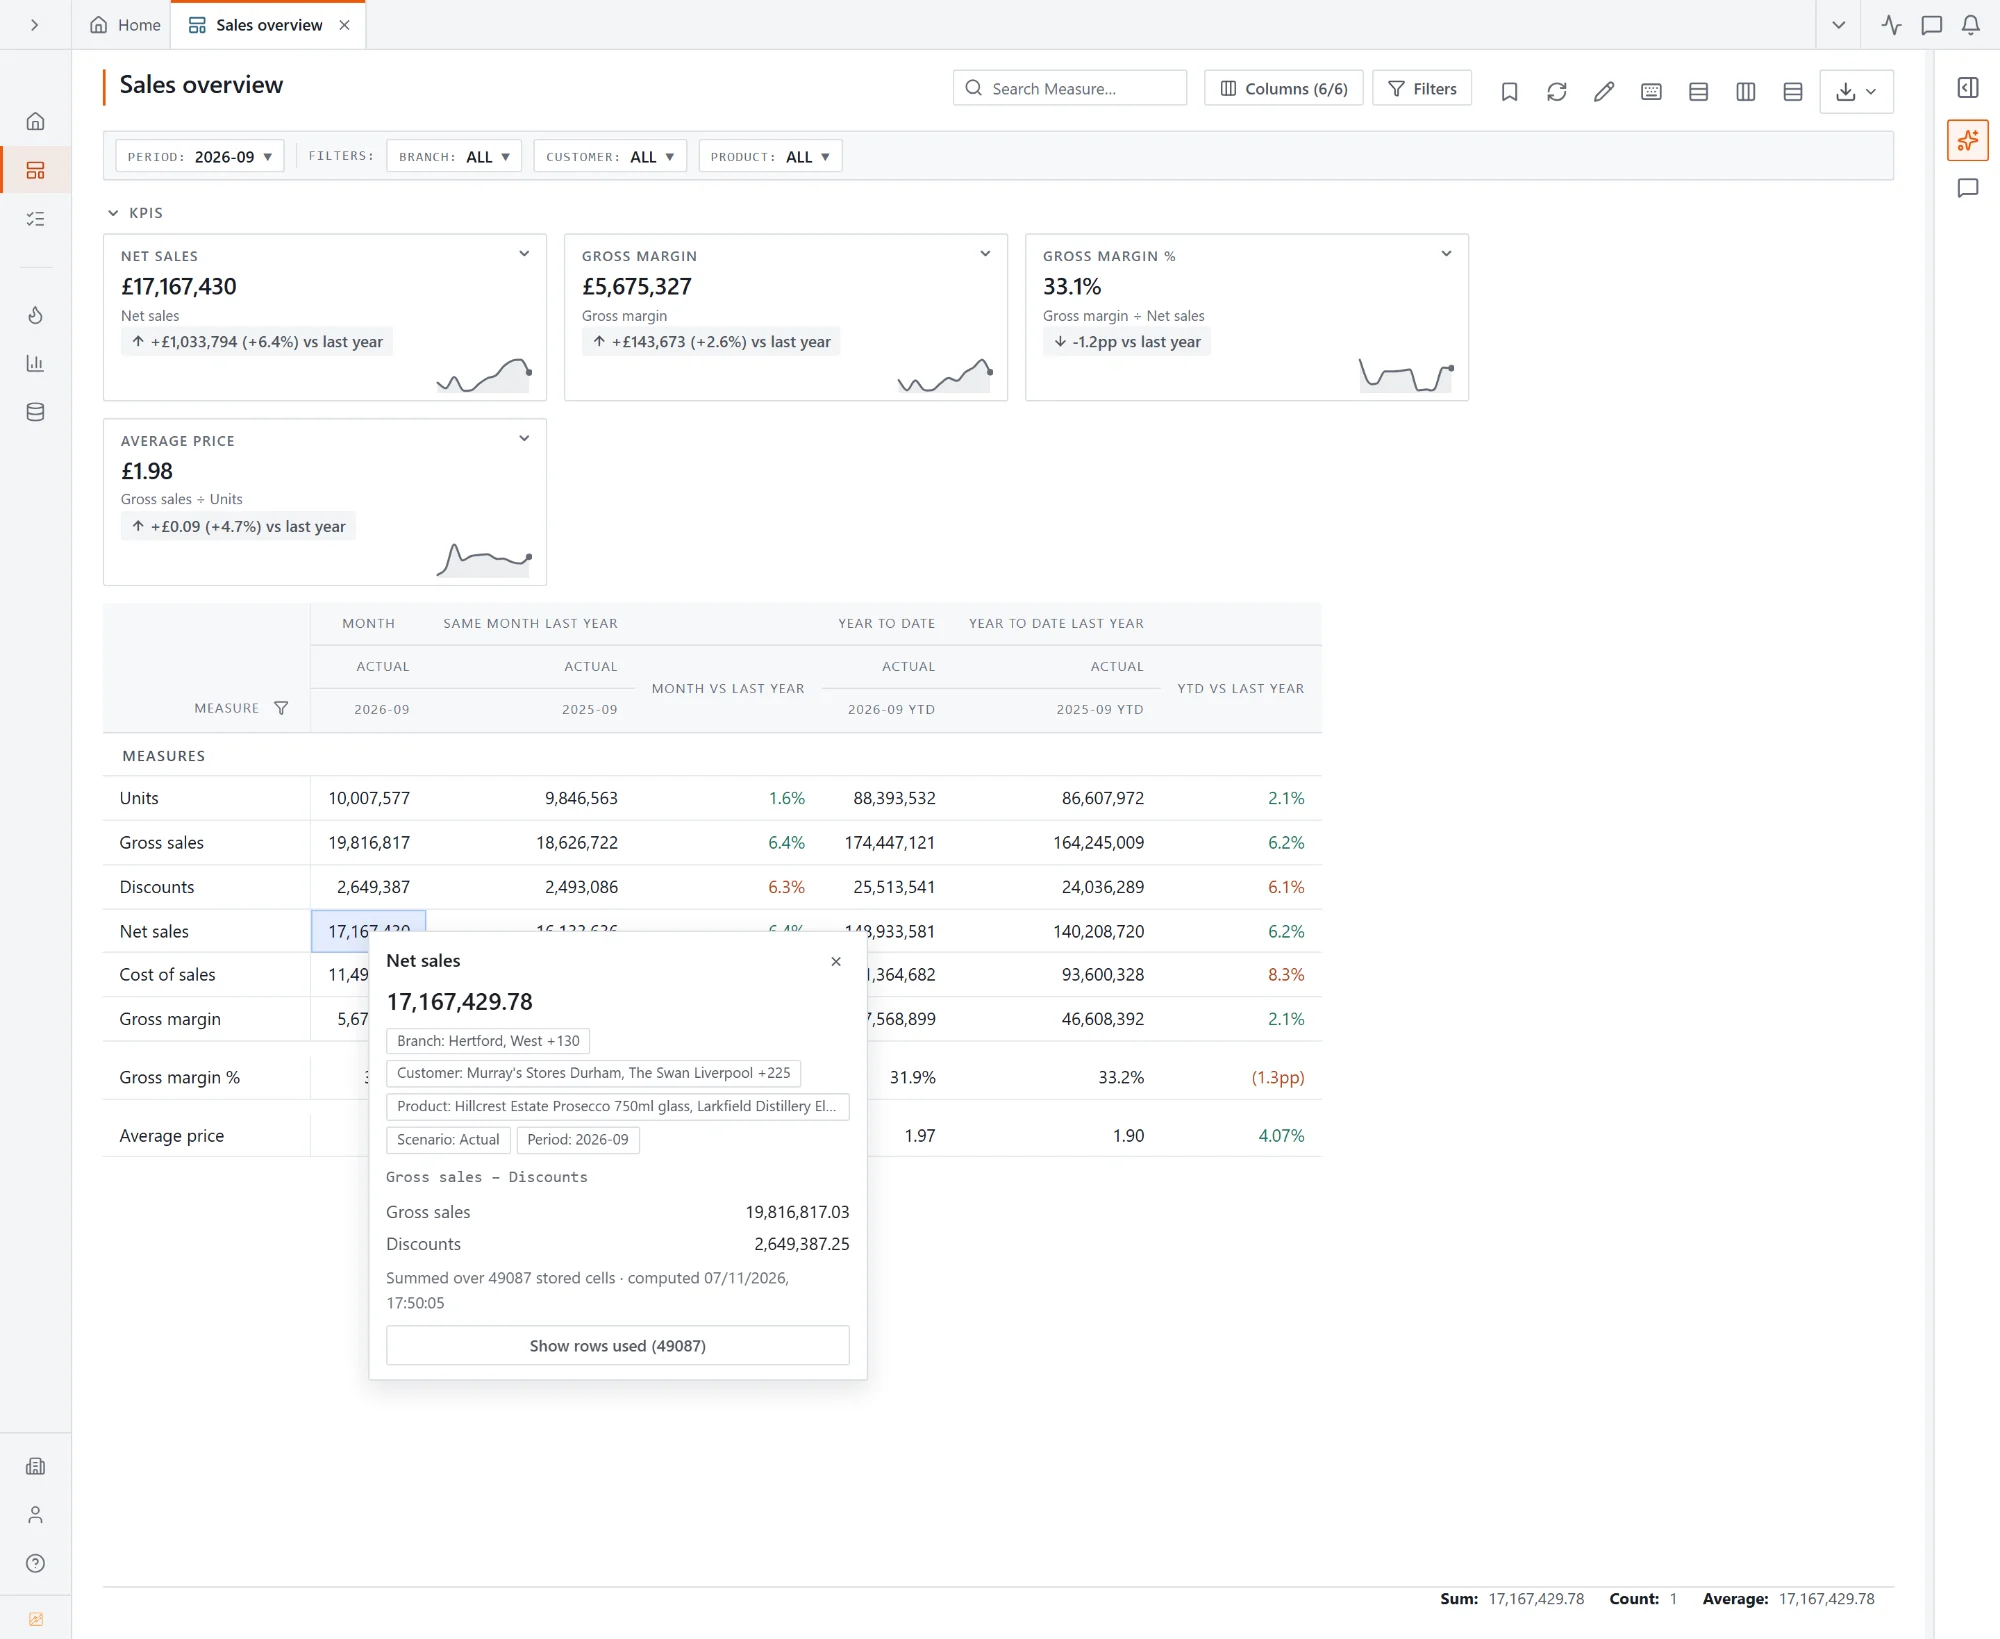
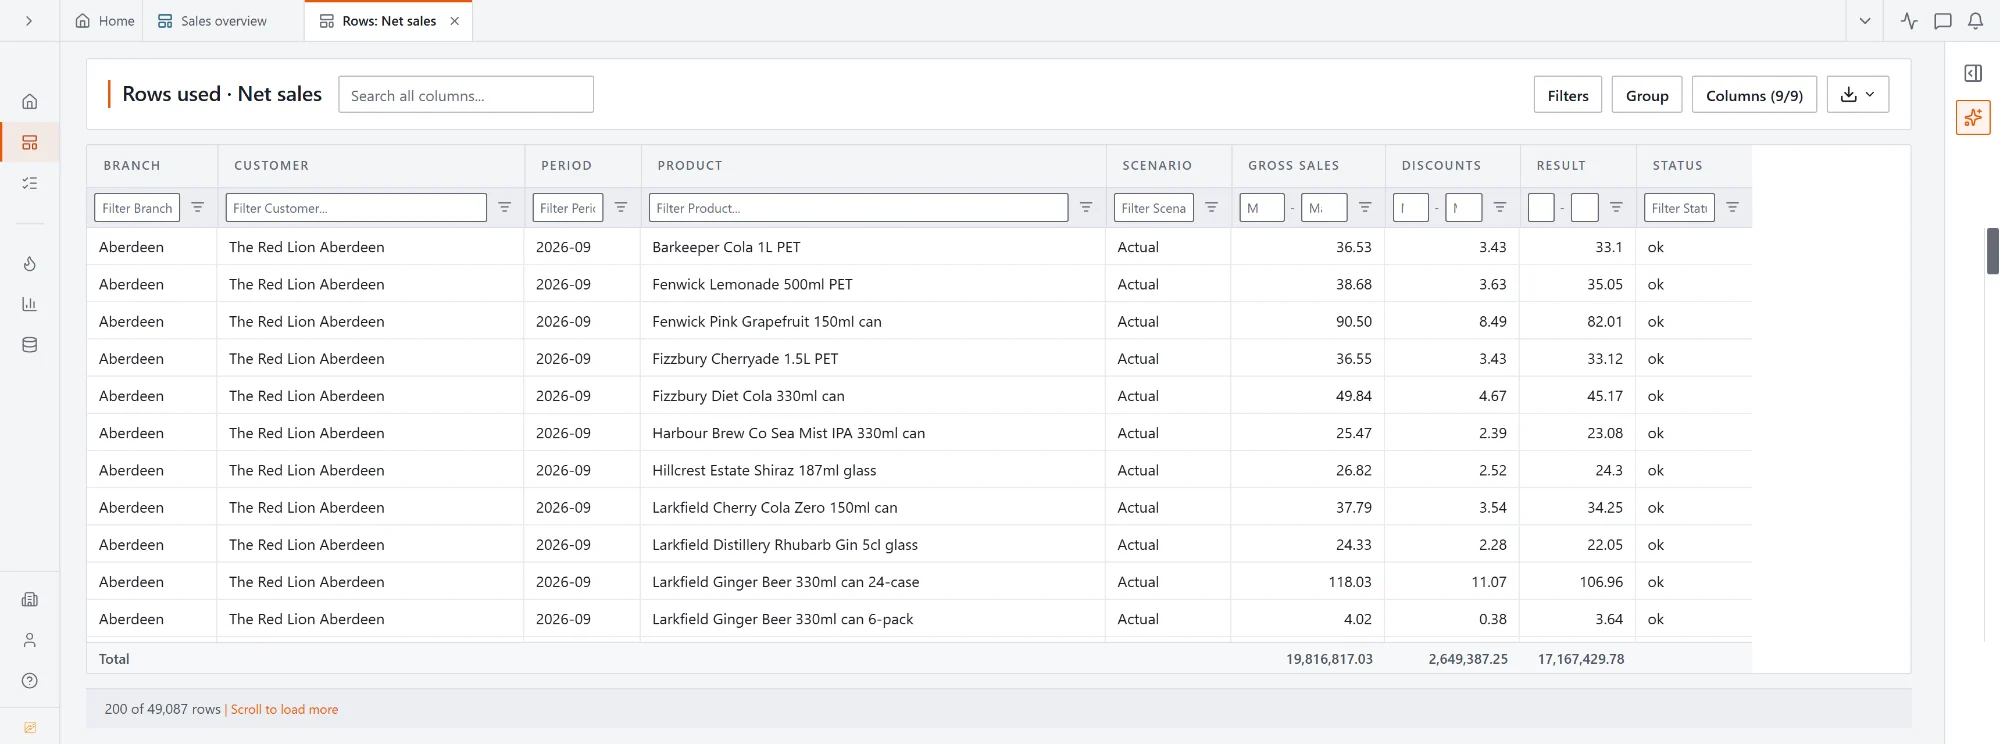
The formula broken down into its parts, row by row: Gross sales − Discounts = Result. Each part totals to the figure in the popover.
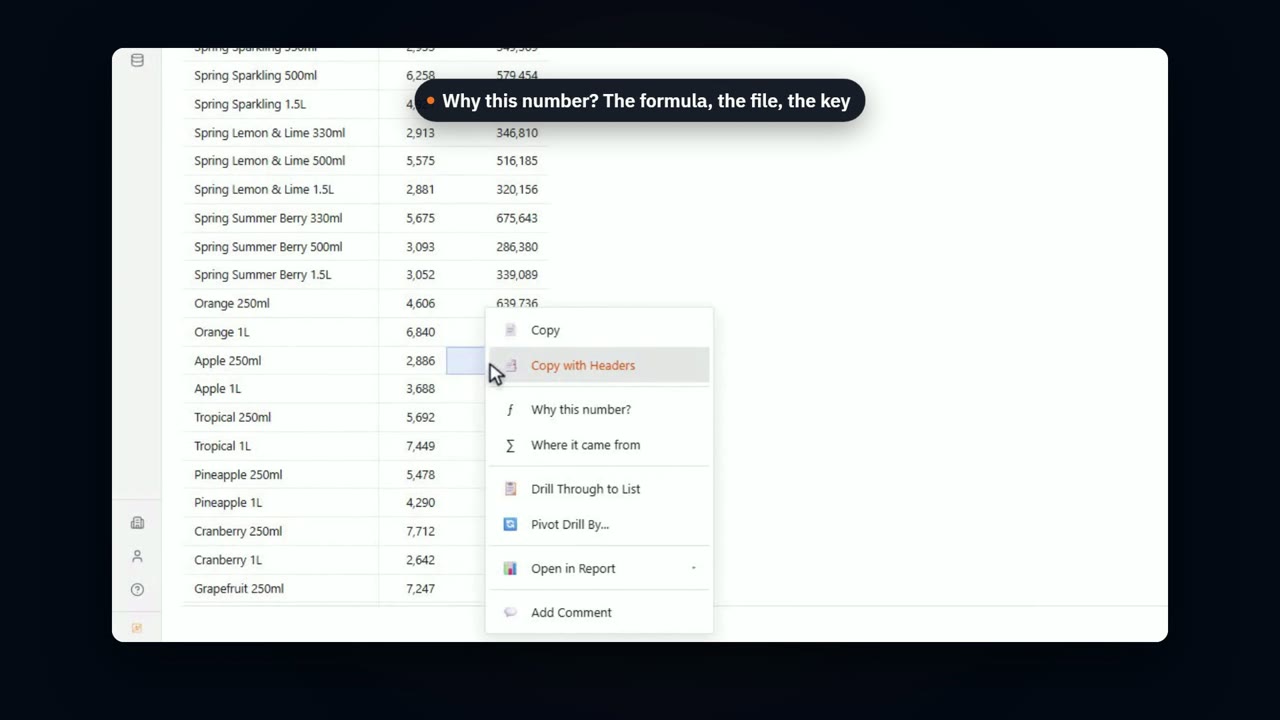
Right-click a number and see the formula, the values it adds up and the slice it covers. One more click lists the rows behind it, each with its parts and its result, adding up to the number you started from.
Actual against Budget, Forecast or last year, at every level of every hierarchy.
Split a revenue or cost change into rate, quantity and mix effects.
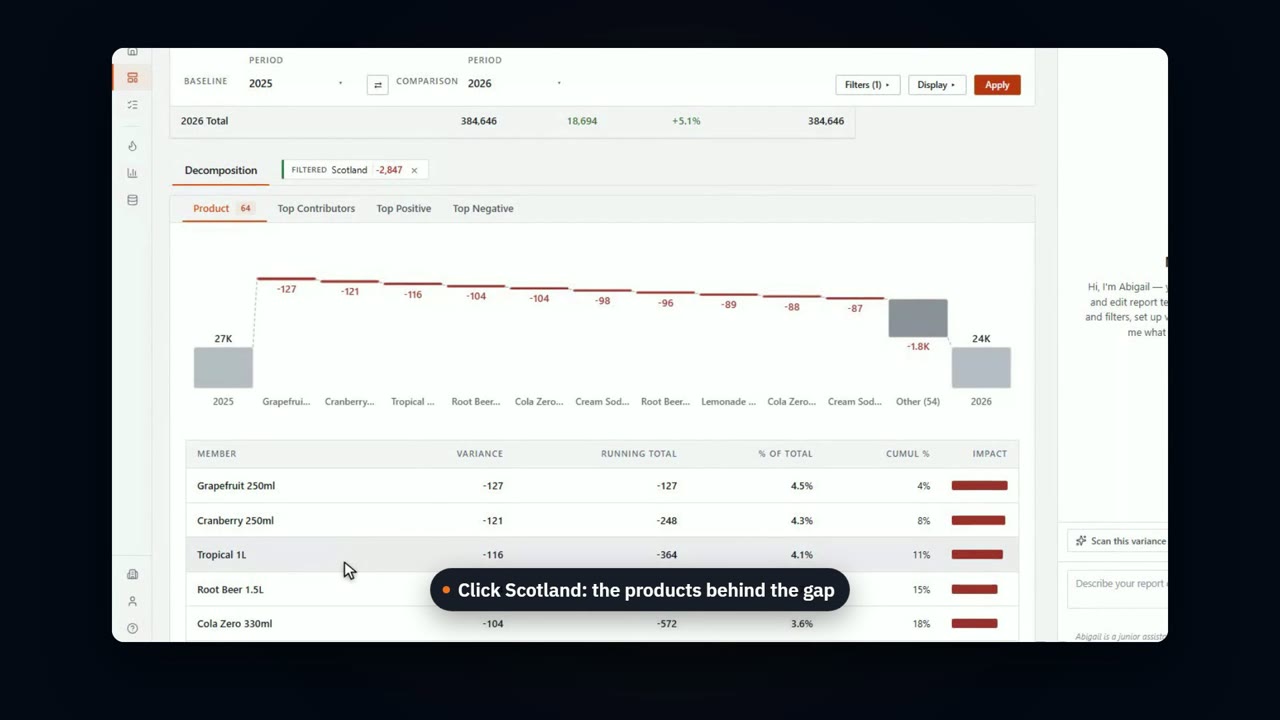
See which lines took you from the baseline to the actual, and click any step to rank what is under it.
Match rows on a key to show new hires, leavers, moves and raises as their own bridge steps.
Set what counts as a material change, so the report shows the lines that matter.
Abigail writes the explanation from the numbers, and you edit it before it goes out.
Build a calculated line with a lookup to a file, right in the report. Then ask why a number is what it is.
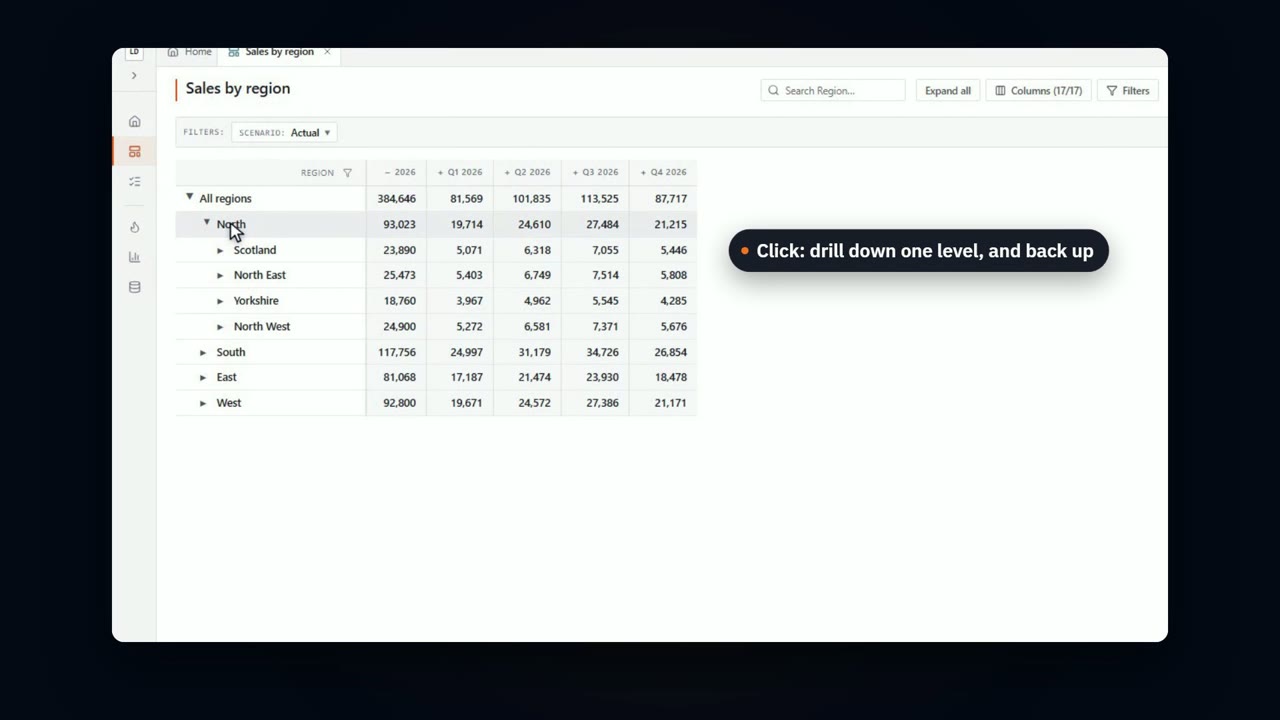
Down a region to the branch, across to the product, and back, on a production-sized report that reshapes as you go.
Book a demo and we'll take a month's variance from the total down to the rows that caused it.