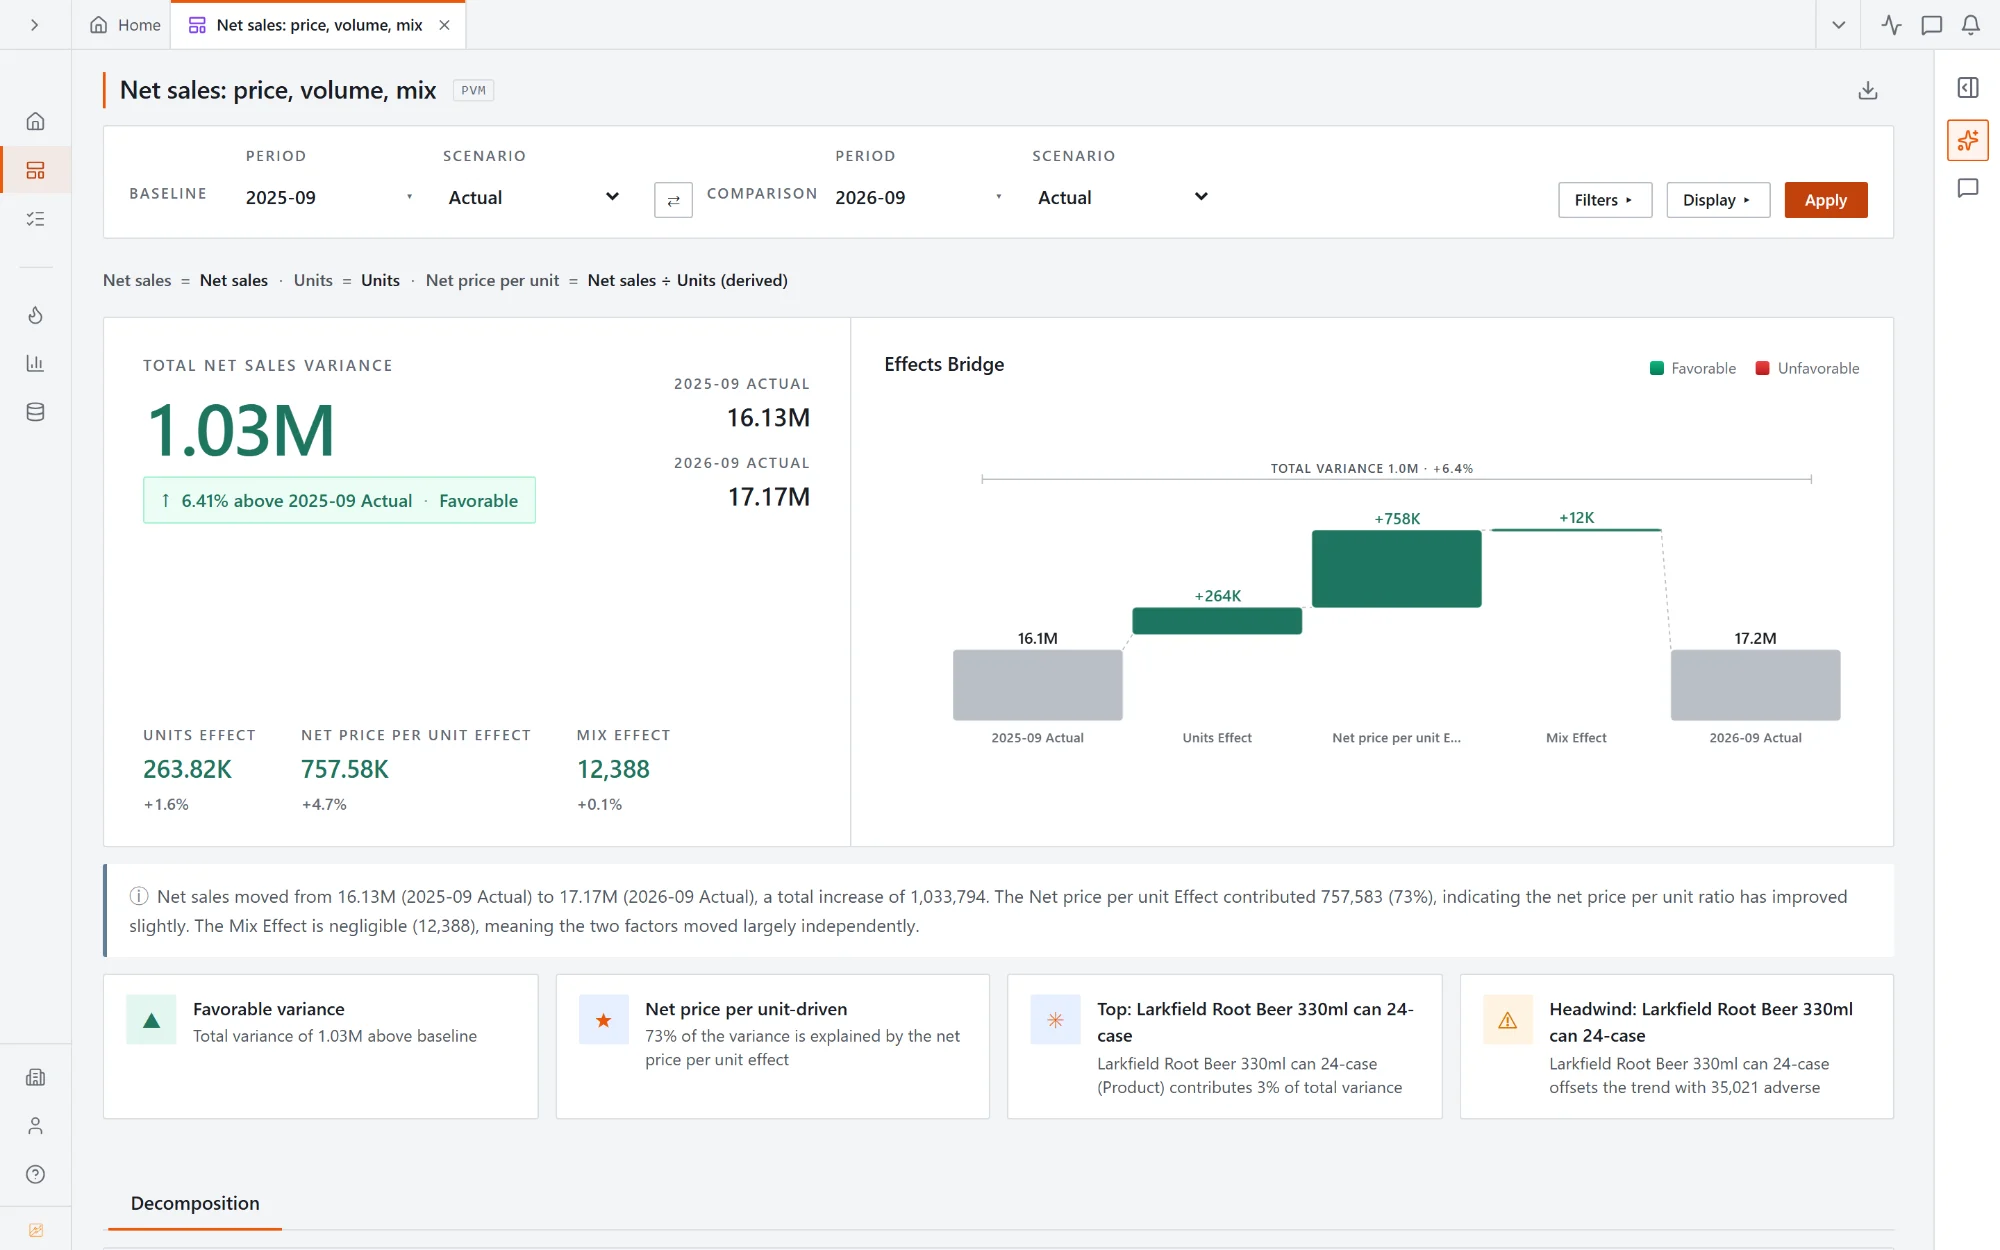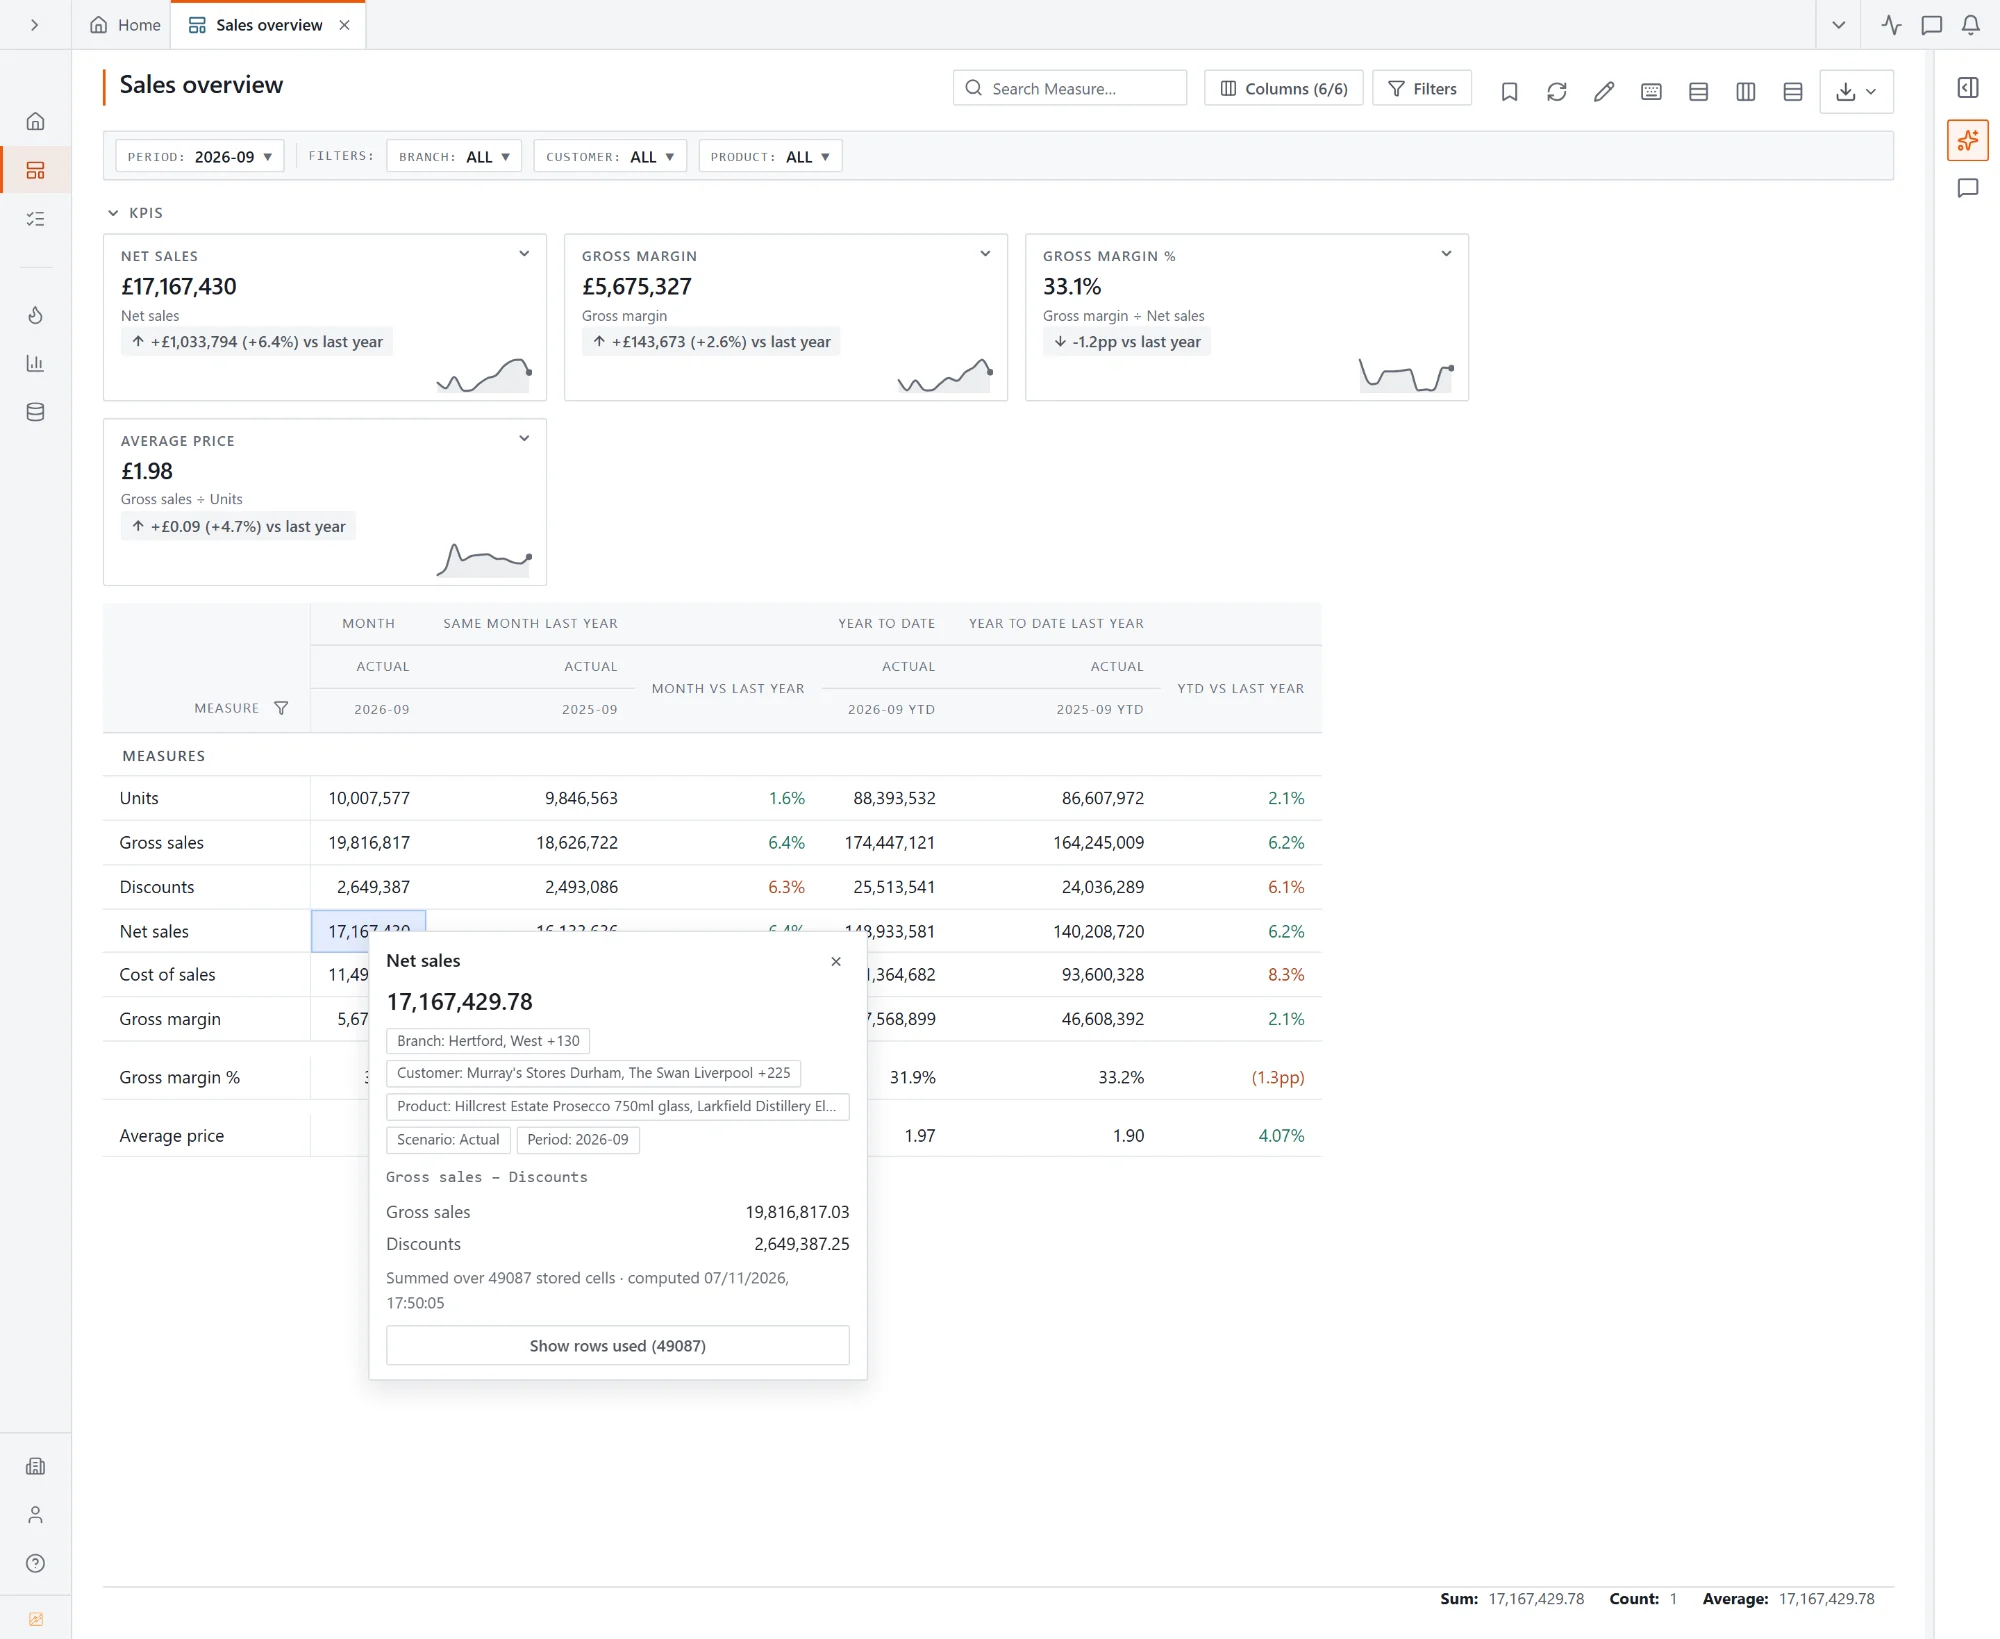
Every close ends the same way: a number moved, and someone senior wants to know why. SwiftBalance turns that from a week of spreadsheet archaeology into a click — decompose the movement, drill to the rows behind it, and capture the explanation next to the number.

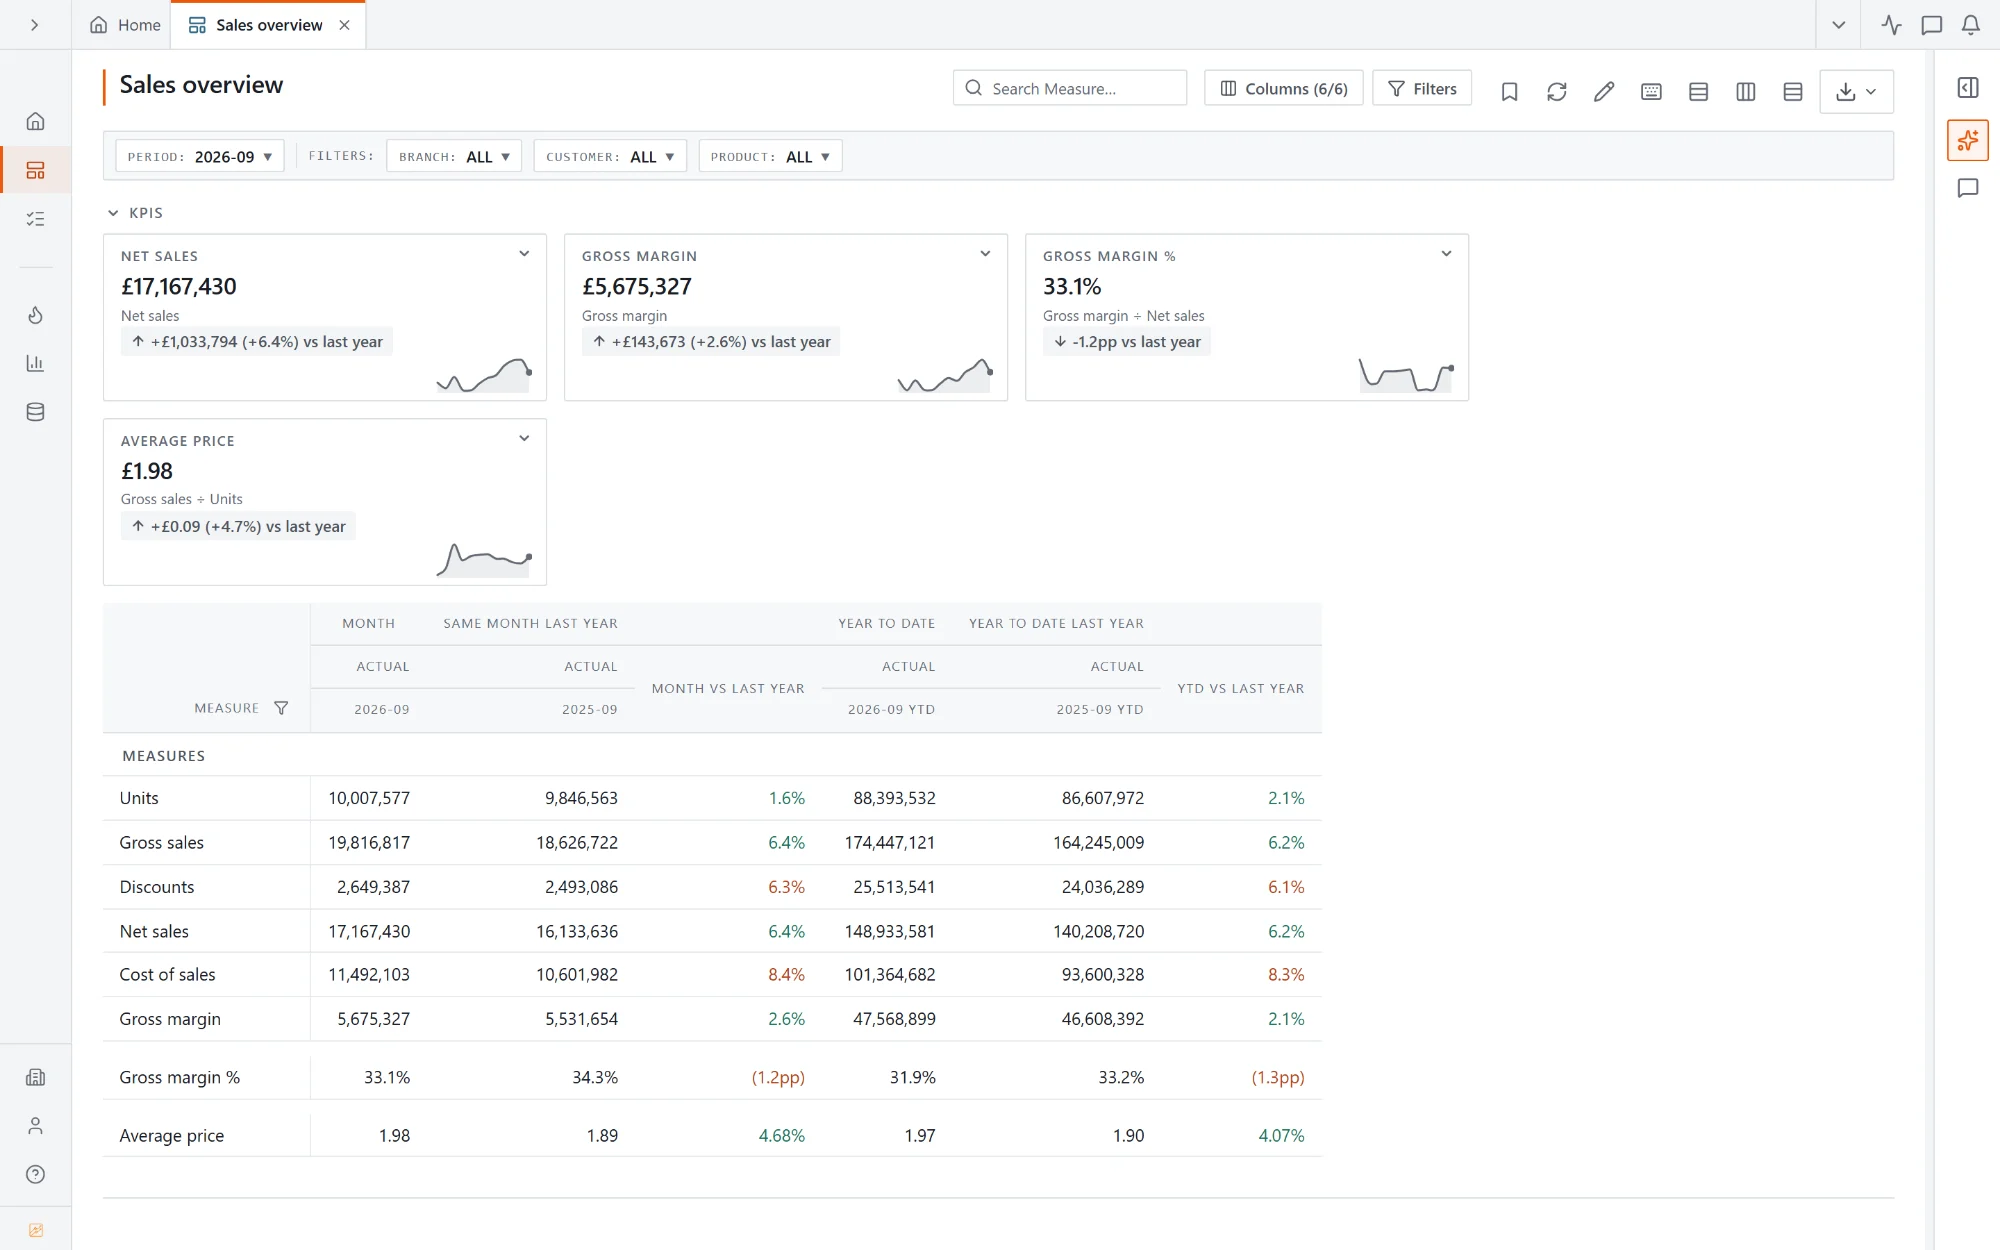
One template shows the whole story — any two scenarios side by side, variances computed at every node of your hierarchy, favourable and adverse styled automatically. Next month's upload refreshes it without touching the layout.


A bridge shows which categories drove the total. Click any bar and SwiftBalance ranks the contributors underneath it — by cost centre, product, region, any dimension — until you're looking at the rows that caused it.

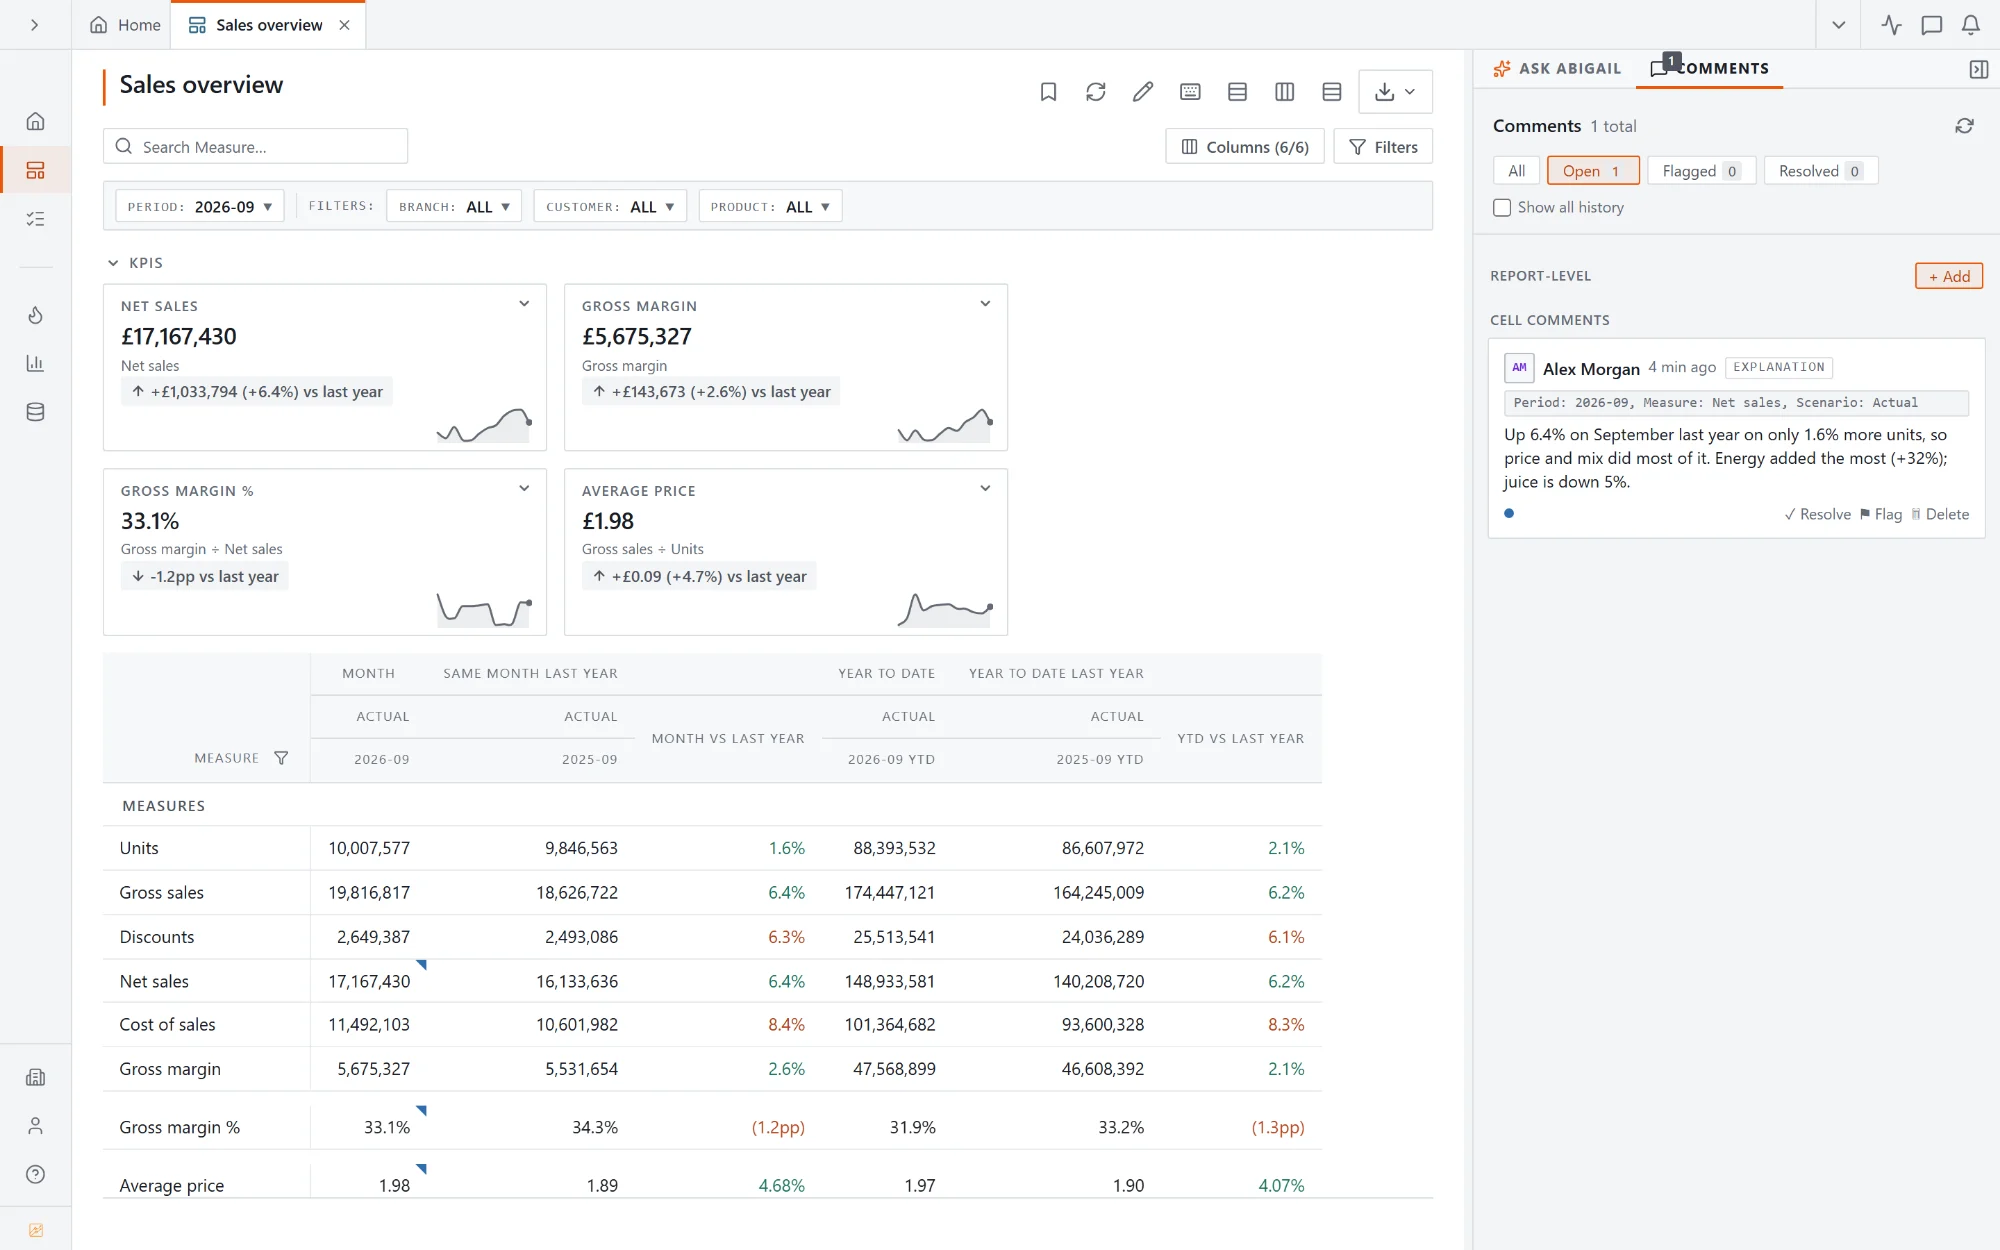
The explanation you chased through email last month? It's pinned to the cell — threaded, @-mentionable, and still there when next period's data arrives. AI commentary drafts the first pass from the decomposition itself.
Drop the actuals and budget extracts you already produce. Periods and scenarios are detected on load.
Shape the P&L once — rows, subtotals, scenario columns, variance columns. Formatting is part of the template.
Open the bridge on any movement, drill to the drivers, pin the explanation. The pack exports itself.
No — that's the point. The template holds the layout, scenarios and formatting. Each period you upload the new extract and every report reading from that data refreshes.
Yes. Actual, Budget, Prior Year and Forecast can sit side by side in one template, each pair with its own variance columns.
The underlying data rows behind the cell you clicked, with the report's filters and the drill path applied — so the number and its rows always tie.
It produces it. Every report exports to styled .xlsx — formatting, hierarchy and variance columns intact — so the pack looks the way it always has, without the week of assembly.
Start free with your latest trial balance and budget, or book a 20-minute walkthrough.