End-of-year offer Planner for the price of Reporter for two years, set up for you during a free 30-day trial. Ten places, start by 31 January.
Product · Across both

Upload once, use everywhere.

Bring the exports you already run from your ledger, payroll or billing system. SwiftBalance checks them, reshapes them and loads them into one model that every report and plan reads.

Book a demoStart free
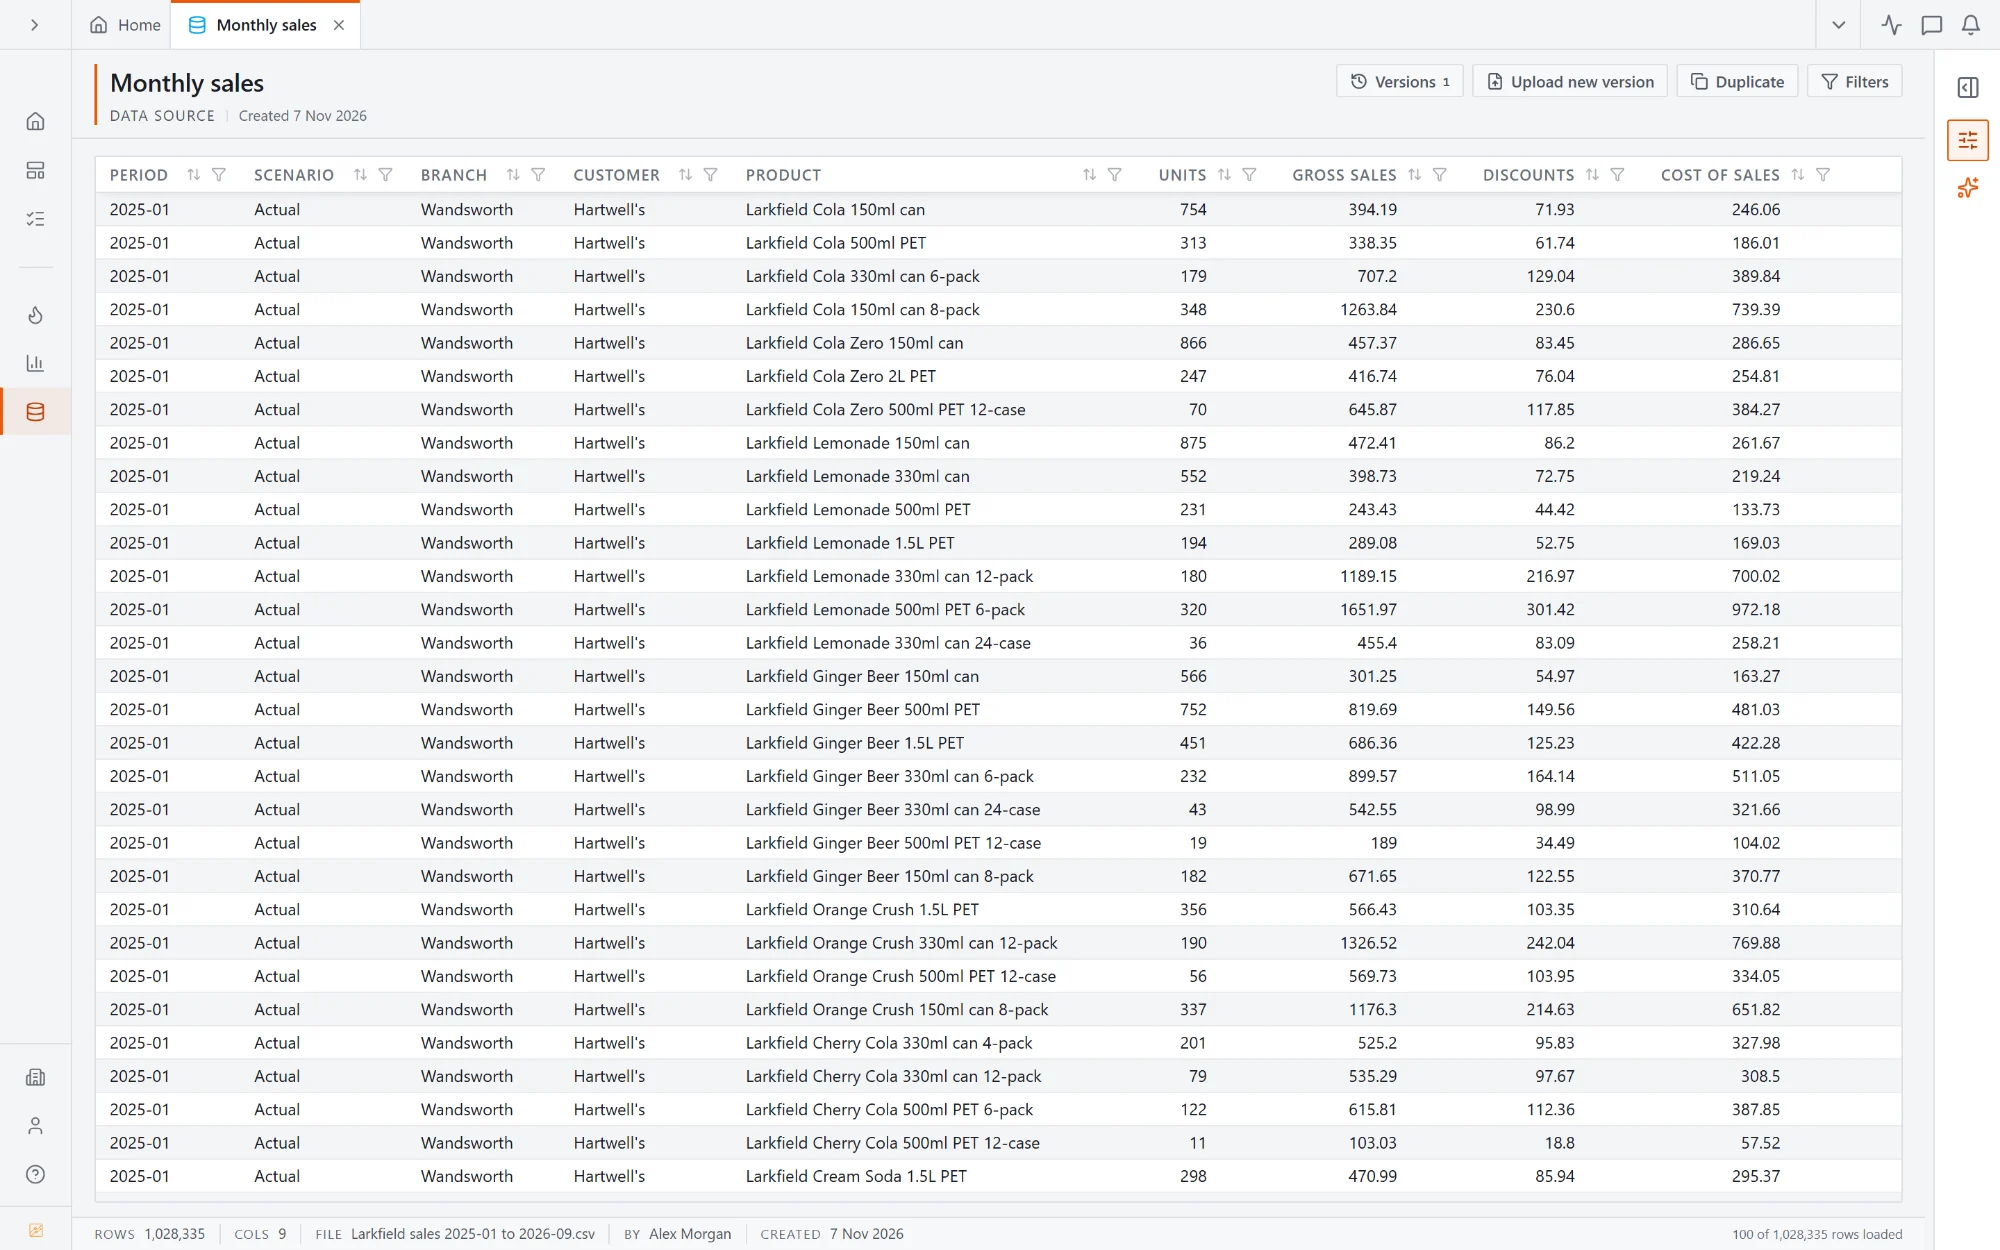
The Monthly sales data source: a million rows of period, branch, customer, product, units and sales
Files

The export you have
is the starting point.

Upload a CSV or Excel file and it becomes a data source: previewed, filtered, versioned. Next month you upload a new version and everything downstream follows.

  • 01A million rows previewed in the browser
  • 02Every upload kept as a version
  • 03Filters and reshaping steps on the source itself
Clean it on the way in

Messy exports in,
tidy data out.

01

Tidy the text

Trim stray spaces, fix the case, pad or strip leading zeros, so codes from two systems finally match.

02

Fix the values

Replace one value with another, split a column in two, or combine two into one.

03

Keep the right rows

Filter on any column, remove duplicates and rows that are all zero, and sort.

04

Add what's missing

Add a column with a formula, join a lookup from another file, or stack a second file underneath.

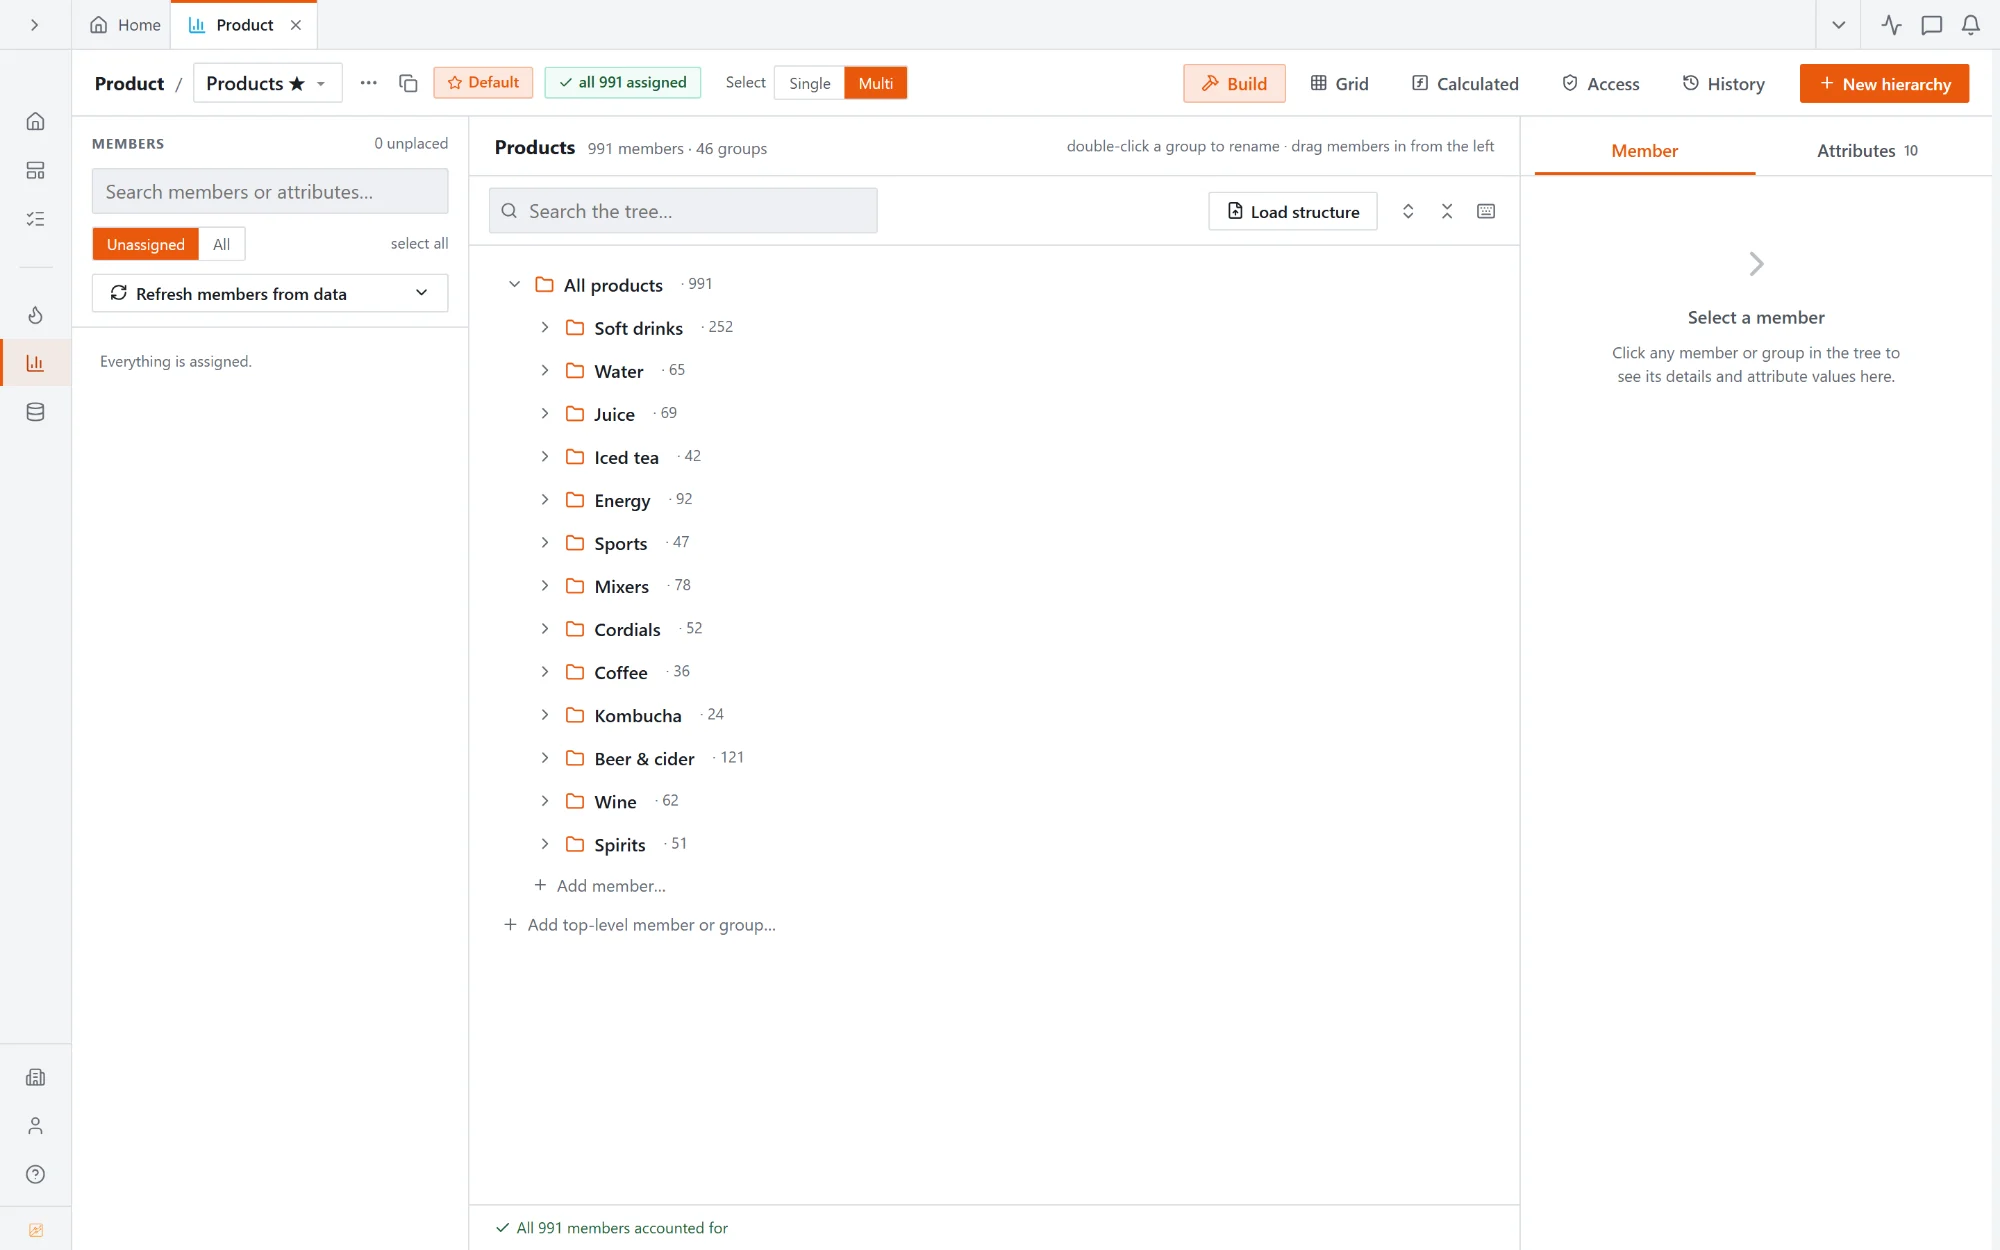
The Product dimension: 991 products in 13 categories, built as a tree
Dimensions

Category, brand, product.
Built once.

Dimensions and hierarchies are shared by every model and report. Drag members into groups, load a structure from a file, and keep attributes such as pack size or launch date on each member.

  • 01Several hierarchies on one dimension
  • 02Attributes on every member, used by rules and reports
  • 03Access per member, by tag
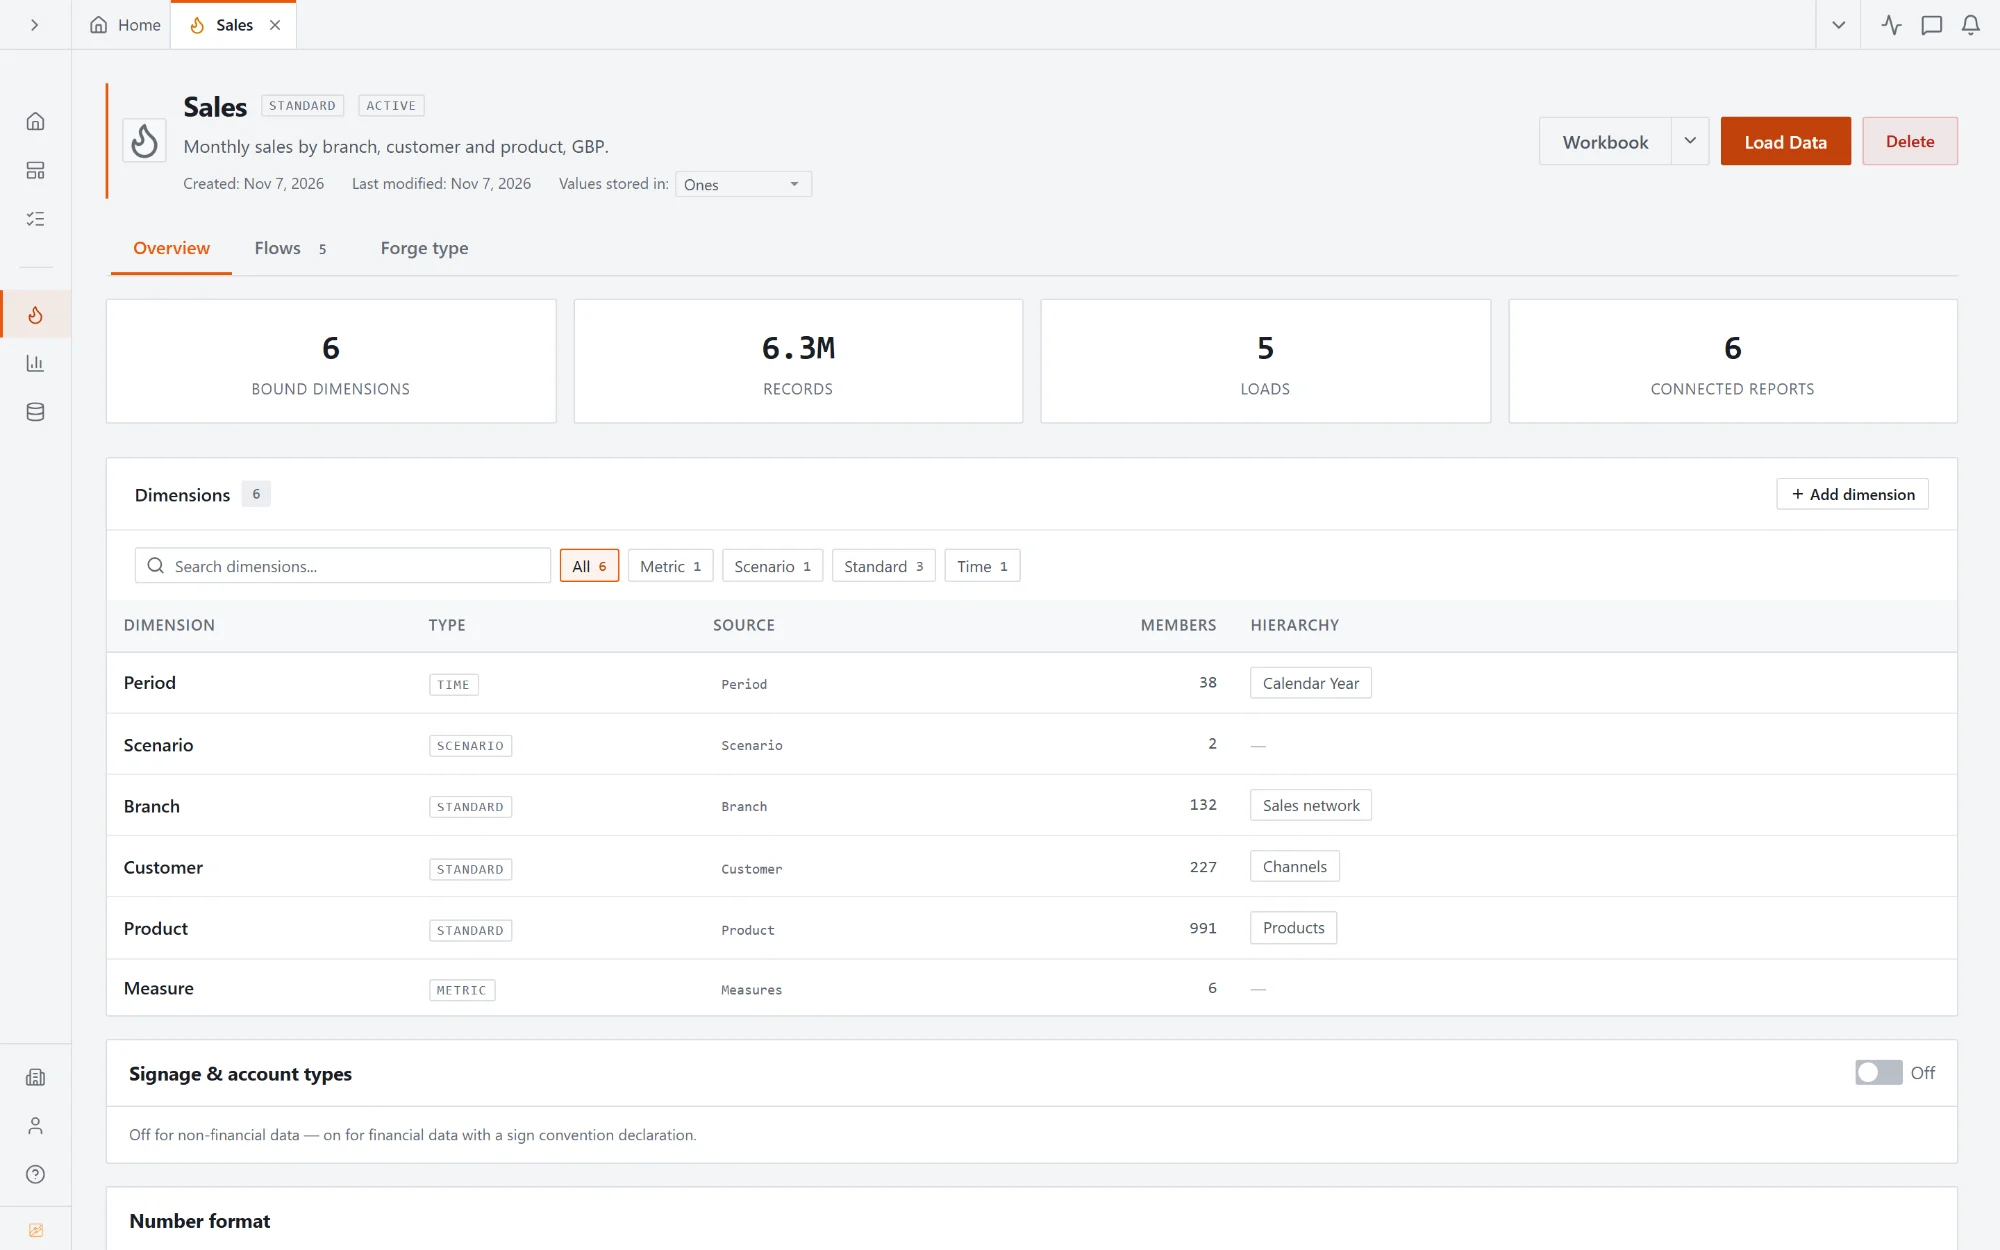
The Sales model: six dimensions, 6.3 million records, five loads and six connected reports
Models

One model,
every report reads it.

A model holds the numbers by their dimensions: period, version, branch, customer, product, measure. Loads, flows and reports all point at it.

  • 01Six dimensions, 6.3 million records, one place
  • 02Load flows that map, check and load each new file
  • 03Every connected report listed on the model
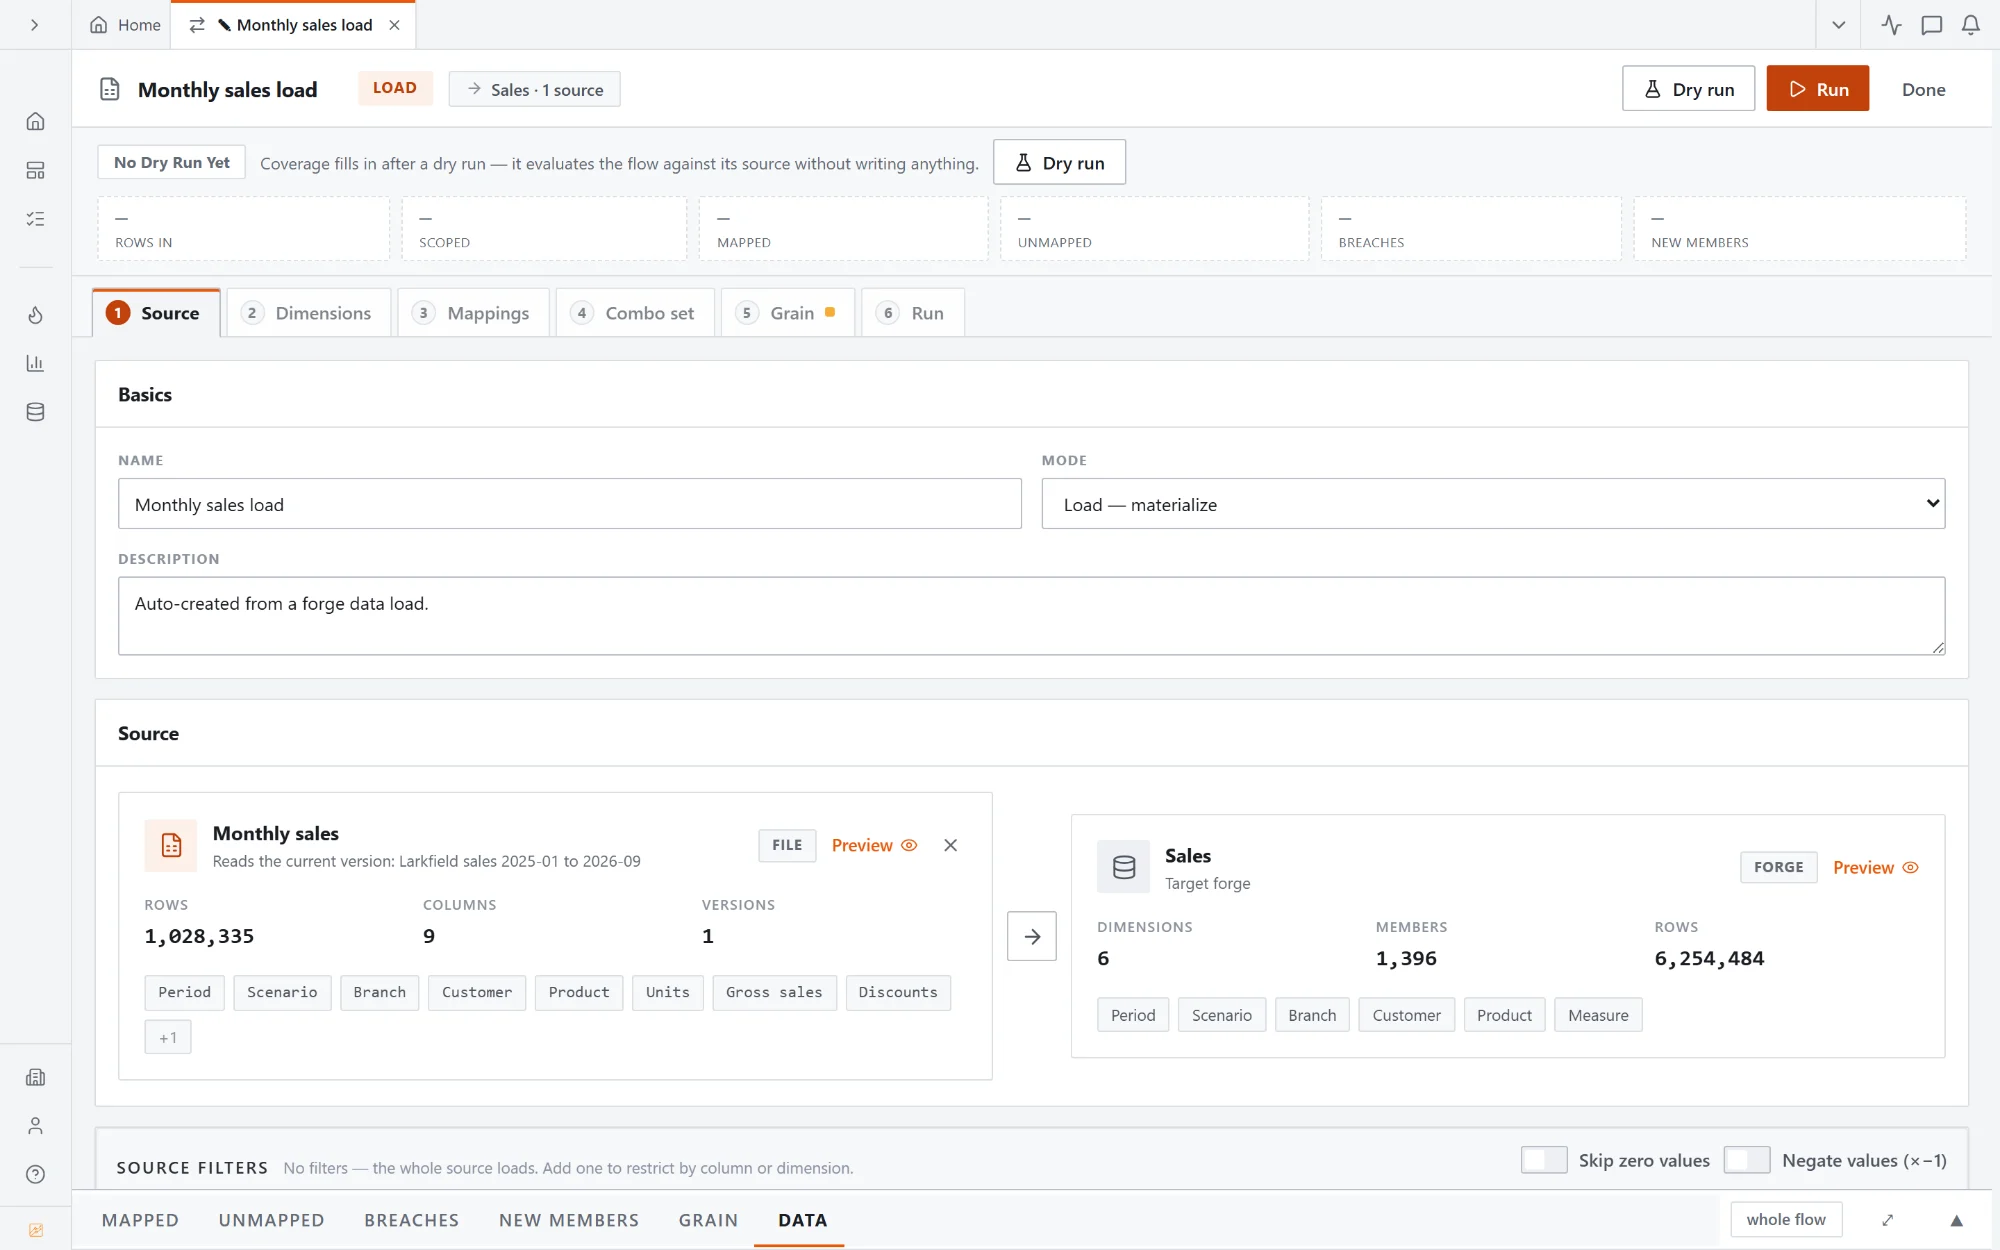
The Monthly sales load flow: a million-row file going into the Sales model, with a dry run that counts mapped, unmapped and new members
Loads

Map it, check it,
then load it.

A load flow takes a file into a model in six steps: source, dimensions, mappings, combinations, grain and run. A dry run shows what would be mapped, what wouldn't and which members are new, before anything is written.

  • 01A dry run before every load
  • 02Unmapped rows and new members listed, not lost
  • 03Filters on the source, skip zeros or flip the sign
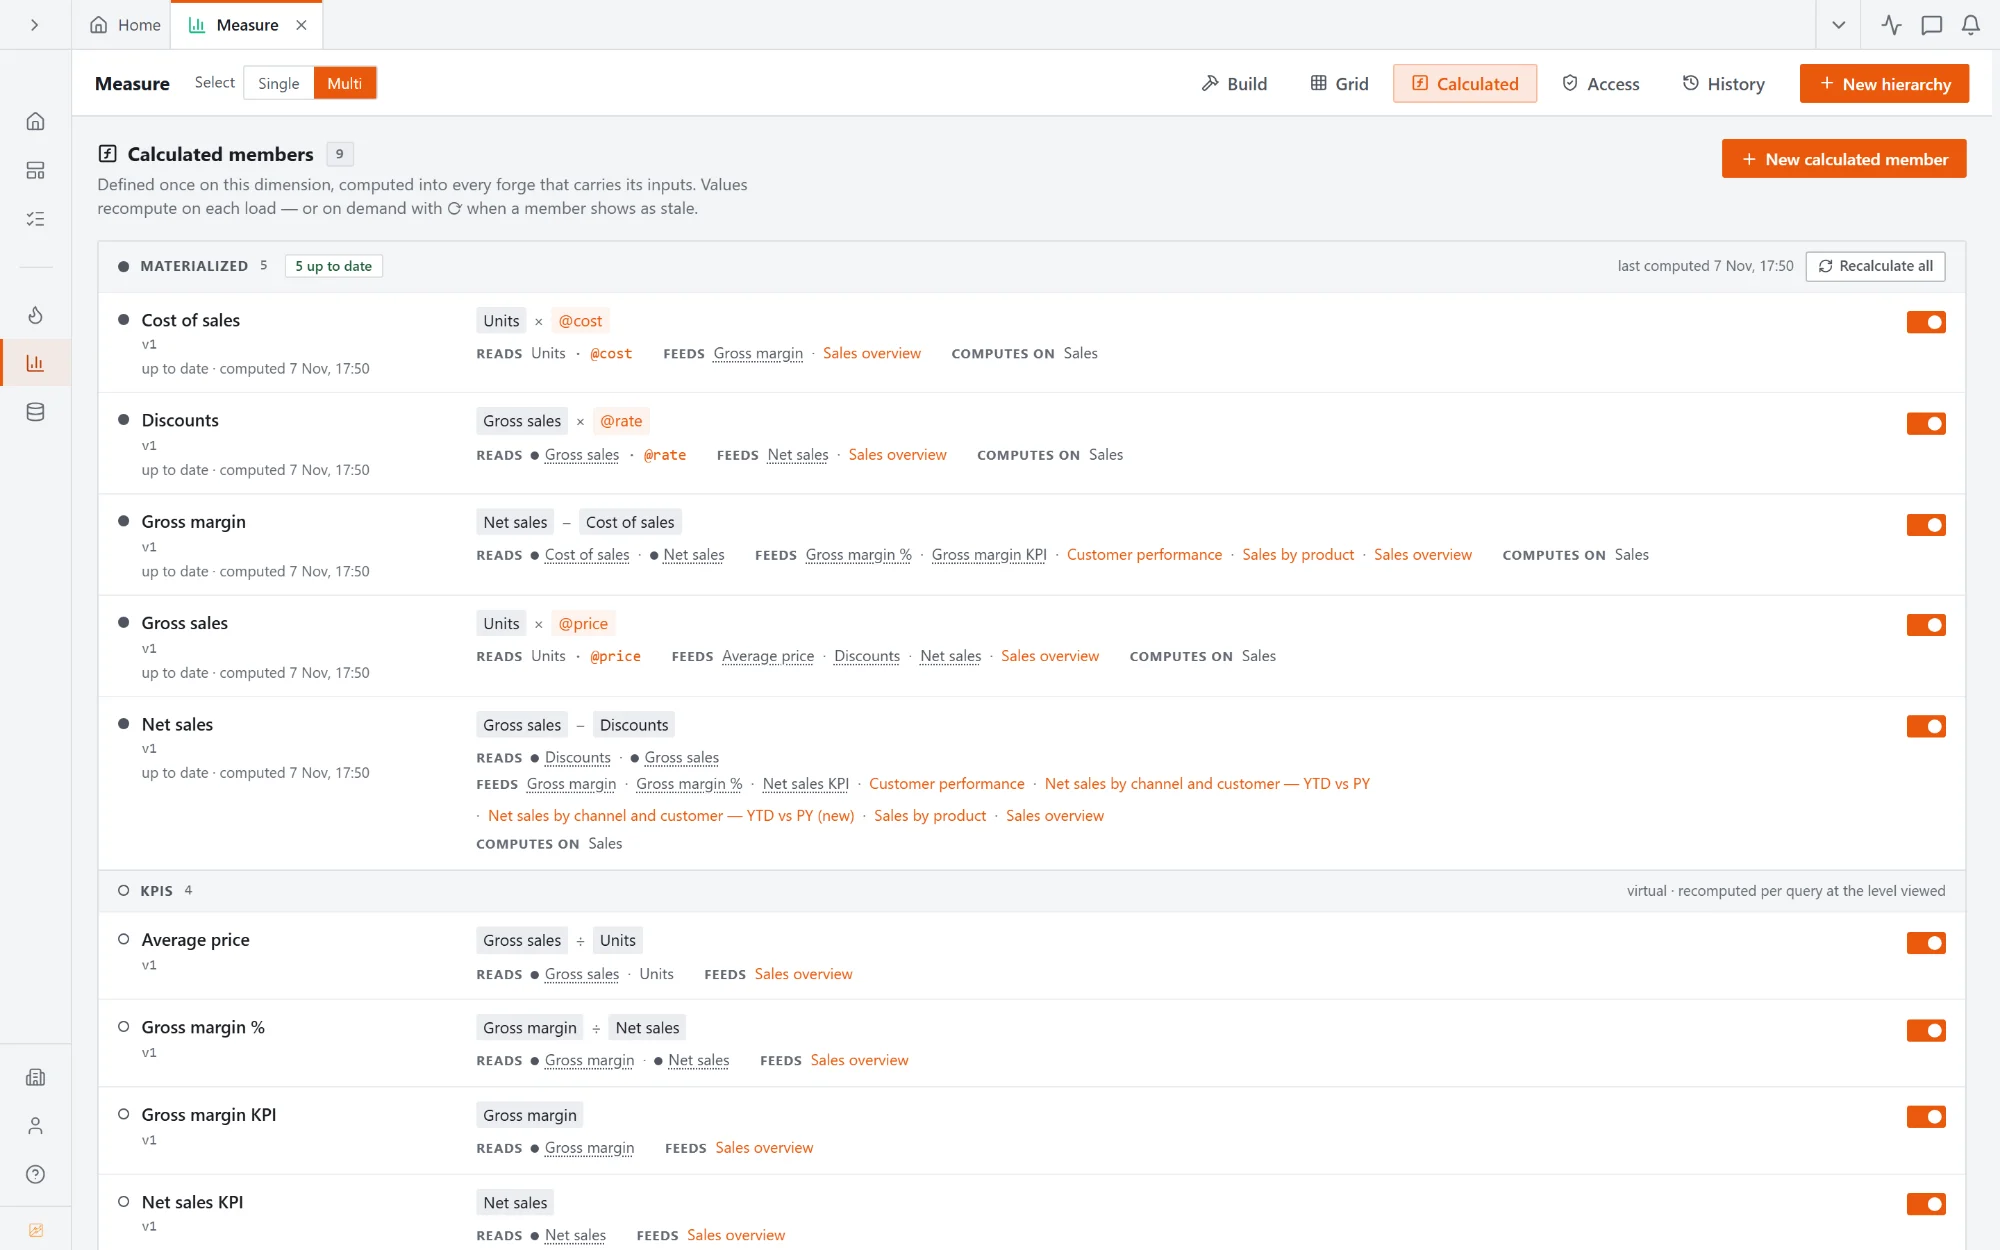
Calculated members on the Measure dimension: cost of sales, discounts, gross margin, gross sales and net sales, each with what it reads and feeds
Calculations

Gross sales, discounts, margin.
Defined once.

Price times units, a rate from a file, margin over net sales. Each calculation lives on the dimension, shows what it reads and what it feeds, and recalculates when new data loads.

  • 01Formulas and lookups to files, written once
  • 02Stored figures, or KPIs worked out at the level you view
  • 03Every report that uses it, listed beside it
What you get

A model finance can build.

01

Upload

CSV, TSV and Excel, several tabs at once. Columns, types and periods are detected for you.

02

Clean

Steps on the data source tidy text, filter rows and join other files, and run again on every upload. The file is never edited.

03

Forges

Your data as a cube: dimensions, measures and periods, built from an upload.

04

Dimensions and hierarchies

Account, branch, product: defined once, with roll-ups and attributes, used by every report.

05

Calculations

Formulas, lookups and allocations defined in the model and run on every version.

06

Member access

Decide who sees which branch, down to a single node, with "View as" to check.

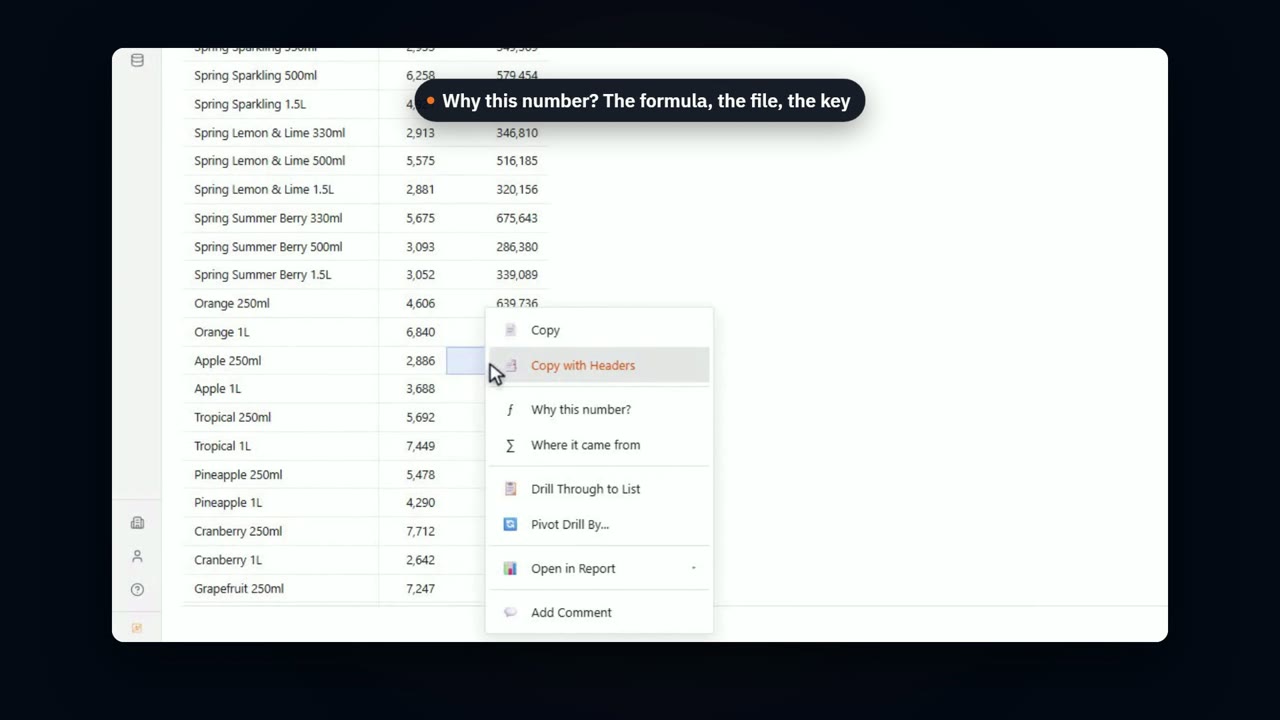
Where does a number come from?

Where does it come from?

Build a calculated line with a lookup to a file, right in the report. Then ask why a number is what it is.

Start from the file you have.

Start free with last month's export, or book a demo to see a model built from one.

Book a demo Start free