End-of-year offer Planner for the price of Reporter for two years, set up for you during a free 30-day trial. Ten places, start by 31 January.
Product · Report the month

Reports that keep up with you.

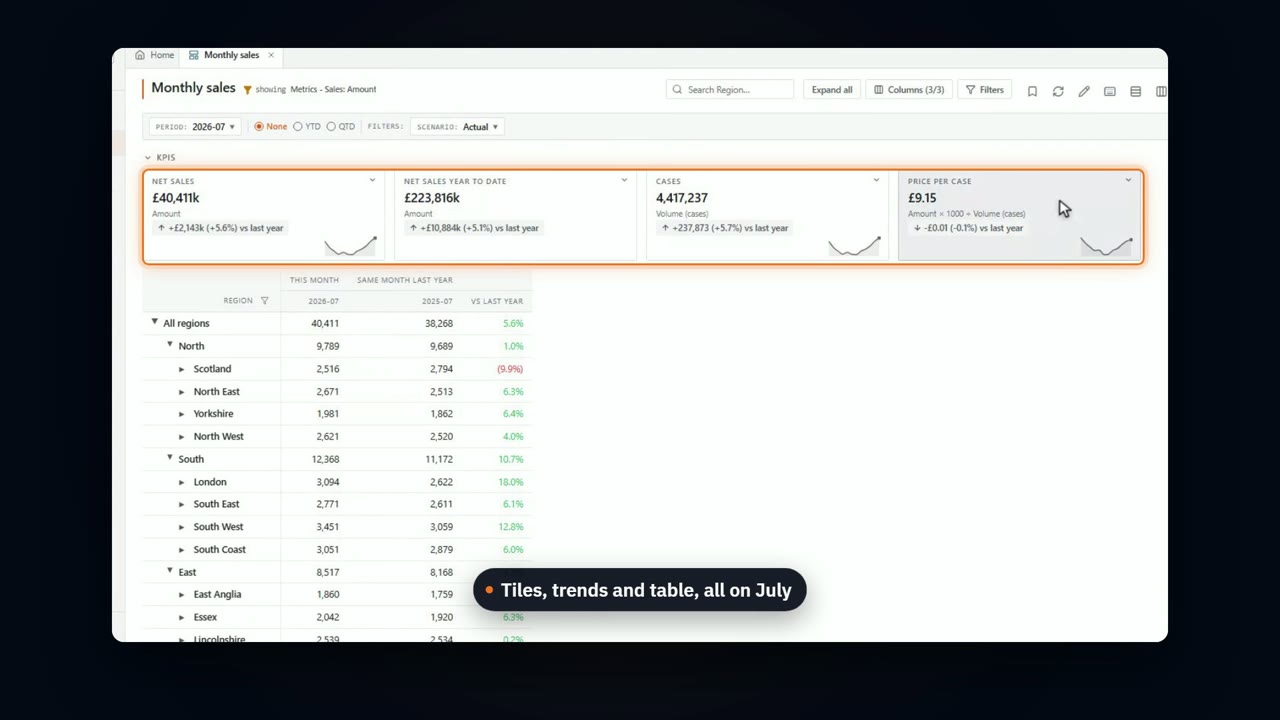
Build the report once, then work it like a spreadsheet that never breaks. Drill a region to the branch, break a line down by product, pick next month, and the layout holds.

Book a demoStart free
See it work

One report, reshaped on every beat.
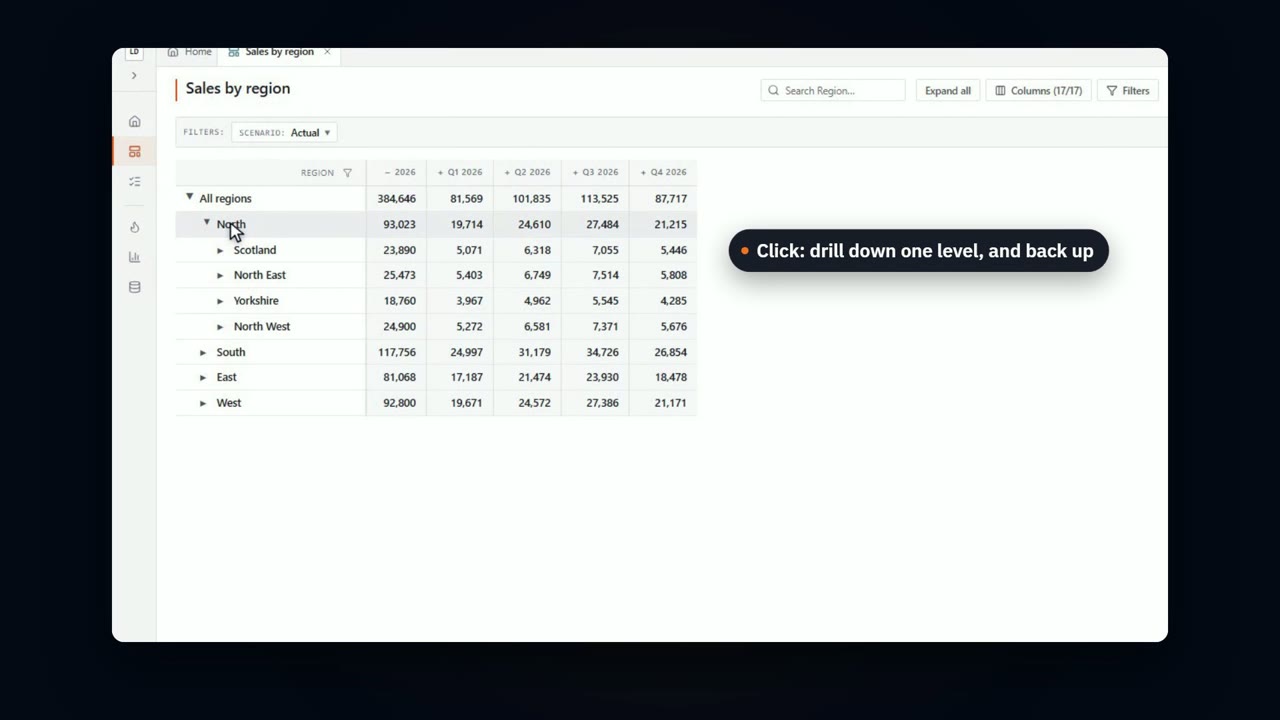
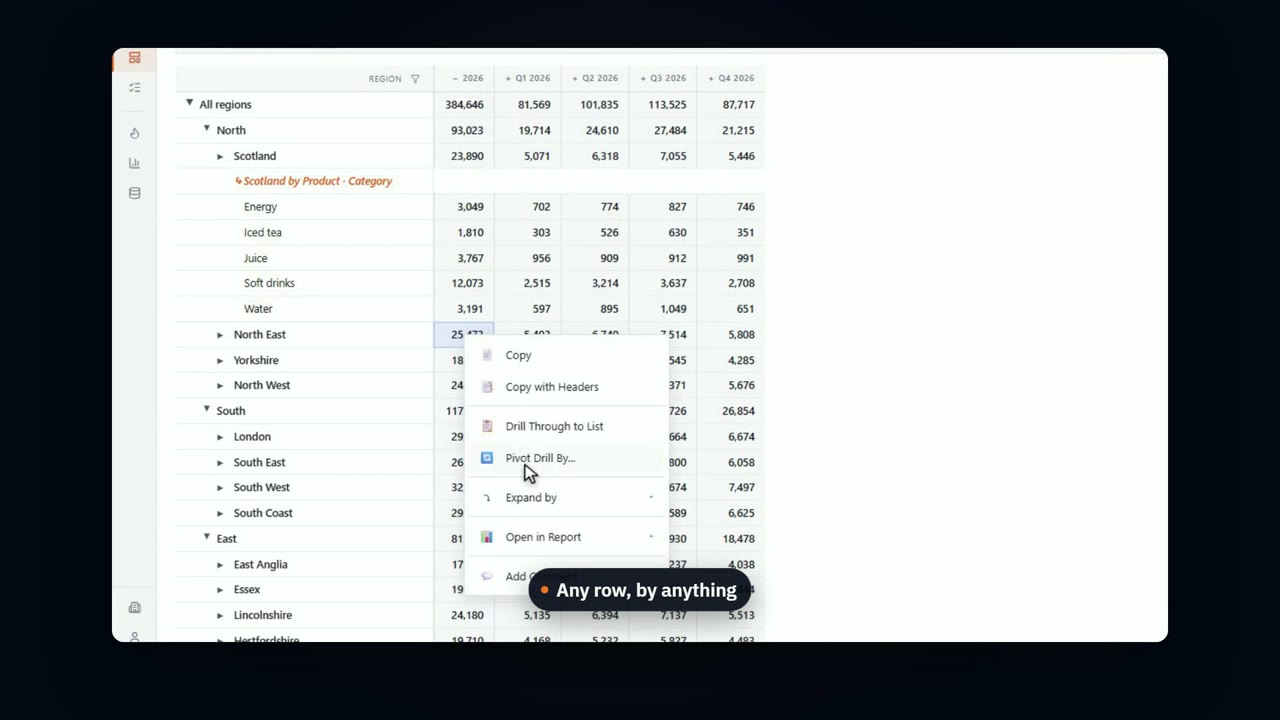
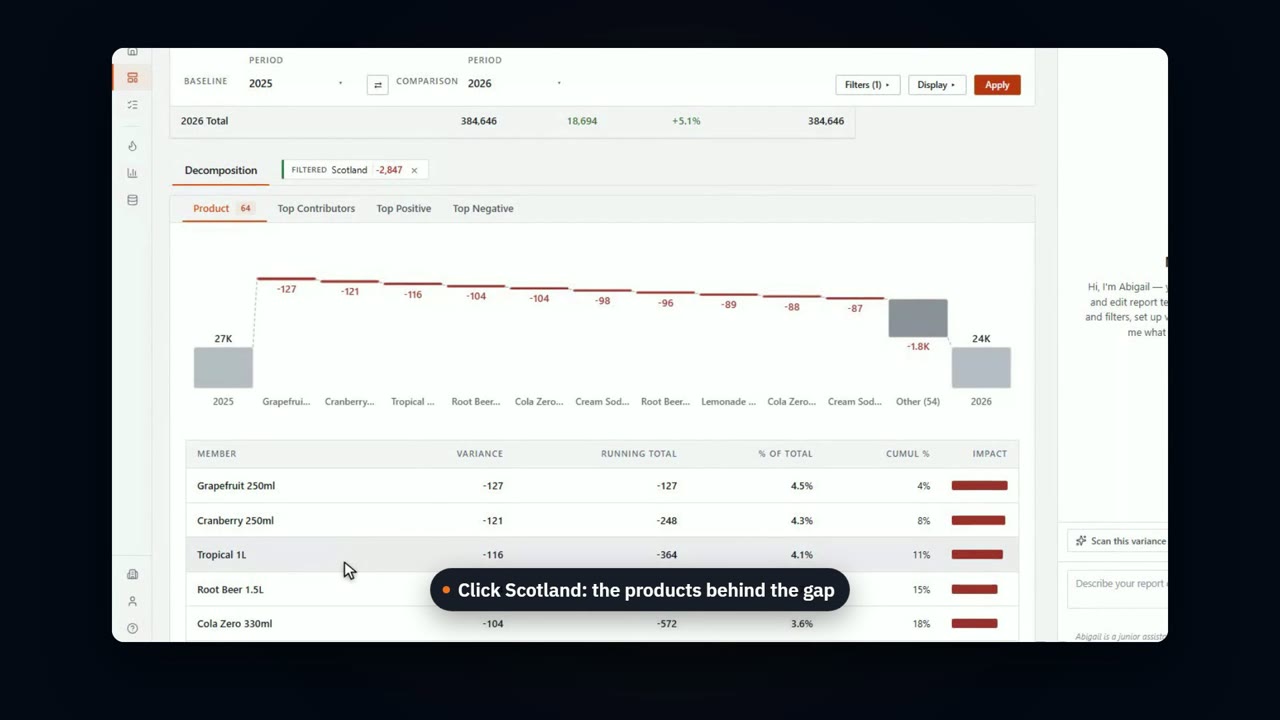
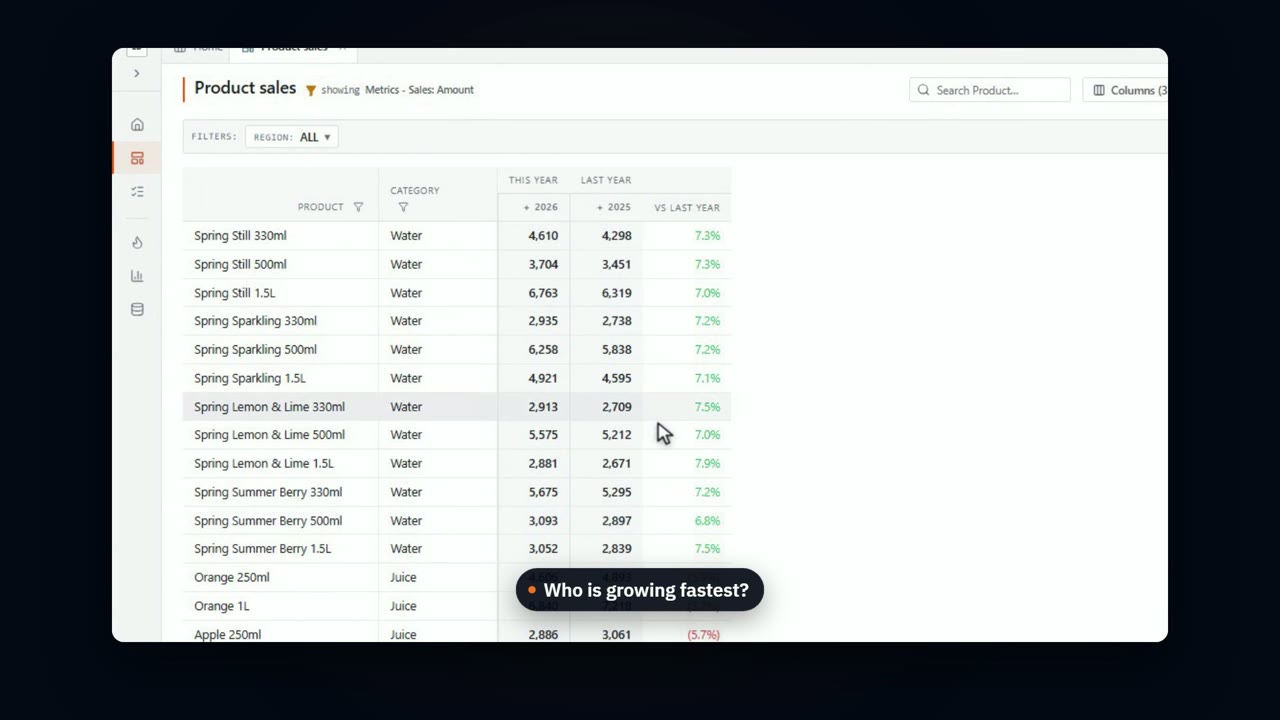
Dynamic drilling Down a region to the branch, across to the product, and back, on a production-sized report that reshapes as you go.

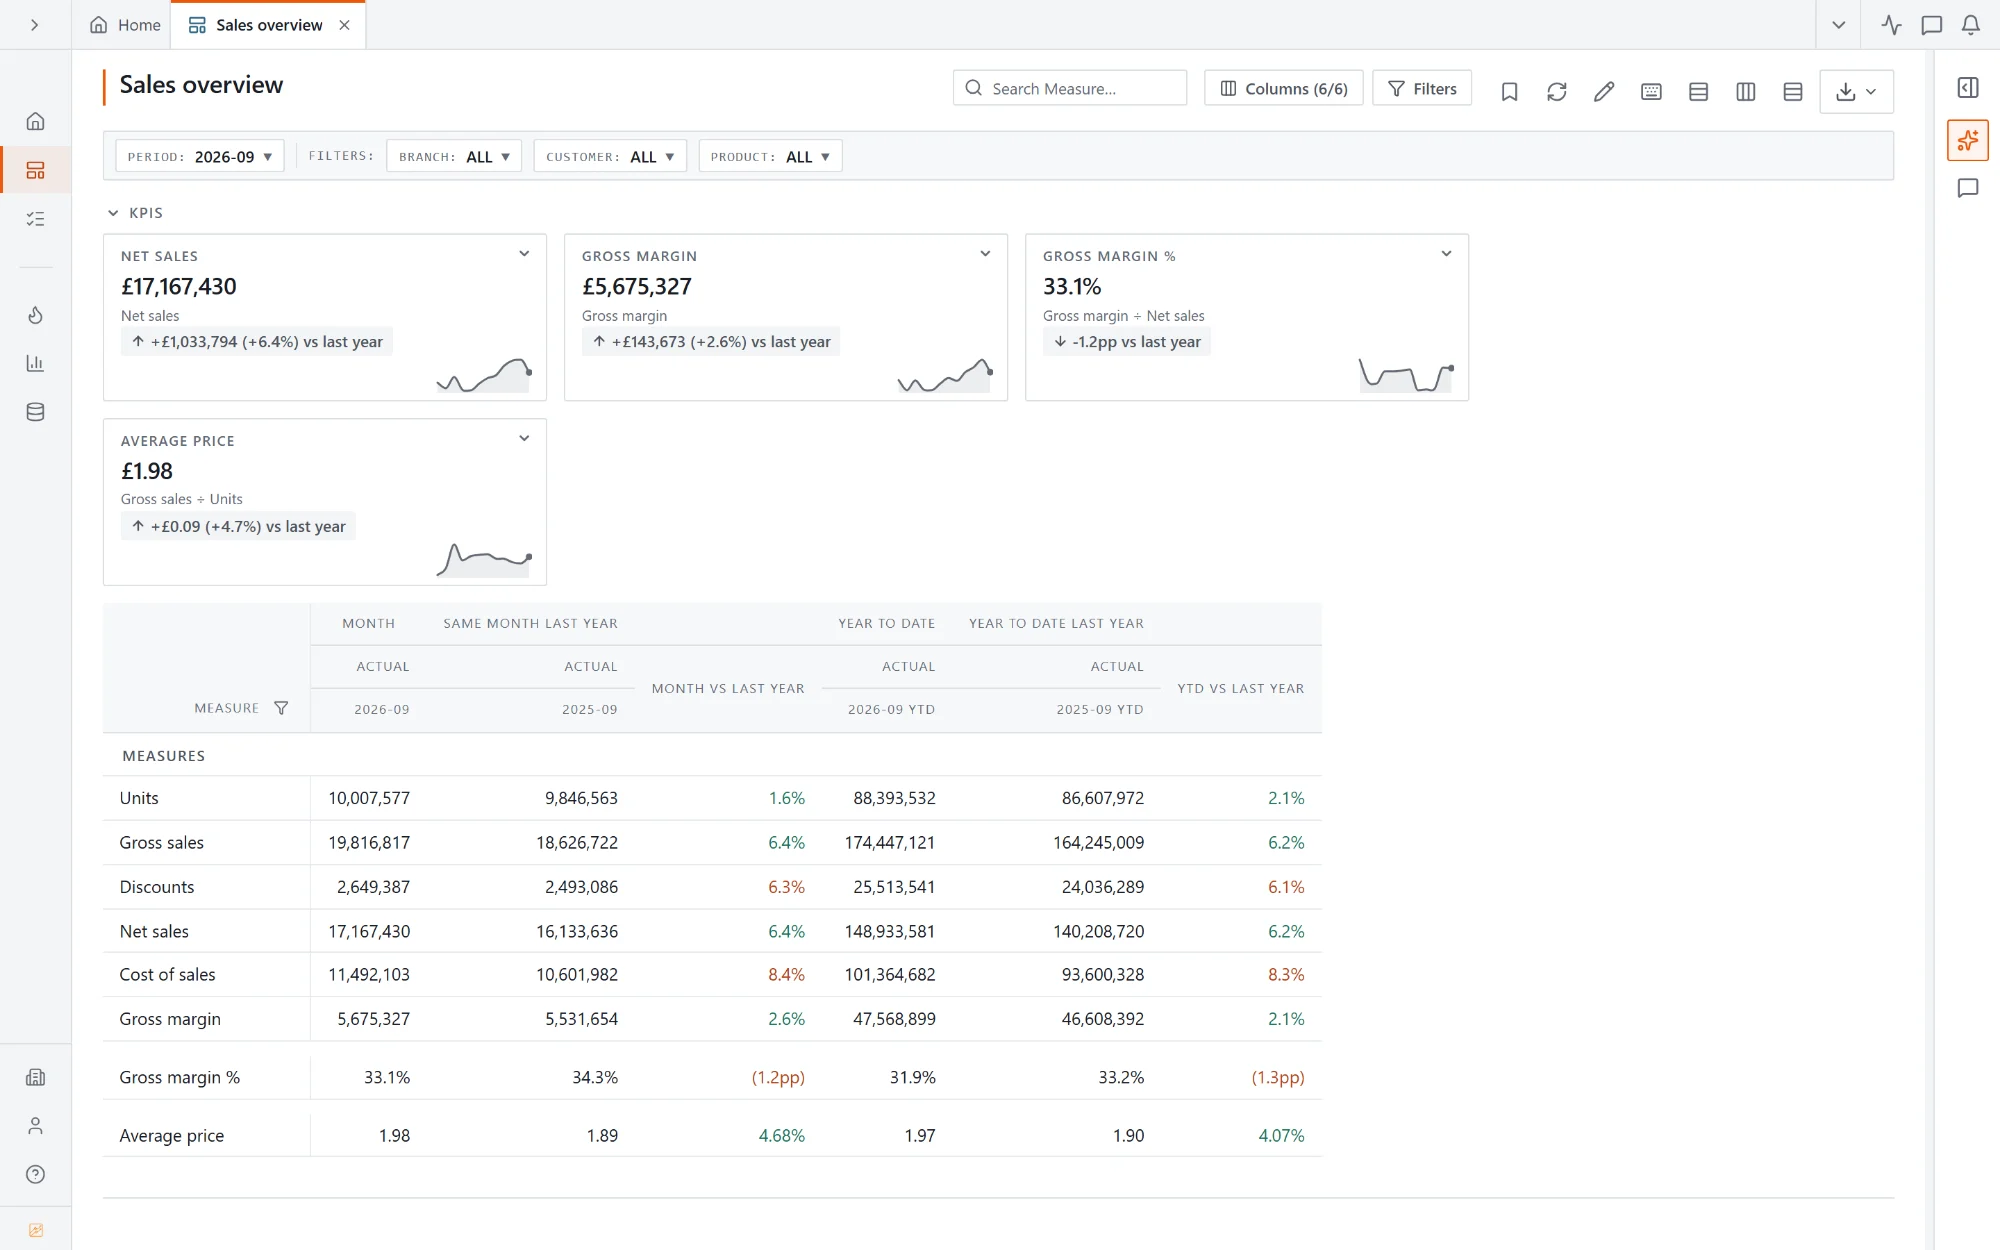
Sales overview: KPI tiles for net sales, gross margin, margin % and average price over a month and year-to-date table
The month at a glance

This month, the year to date
and last year, on one page.

KPI tiles over the table, each with its trend and its change on last year. Pick another month and every figure follows.

  • 01KPI tiles with a sparkline and the change on last year
  • 02Month and year to date side by side, against last year
  • 03Ratios such as margin % move in points, not percent
  • 04Filter by branch, customer or product without rebuilding
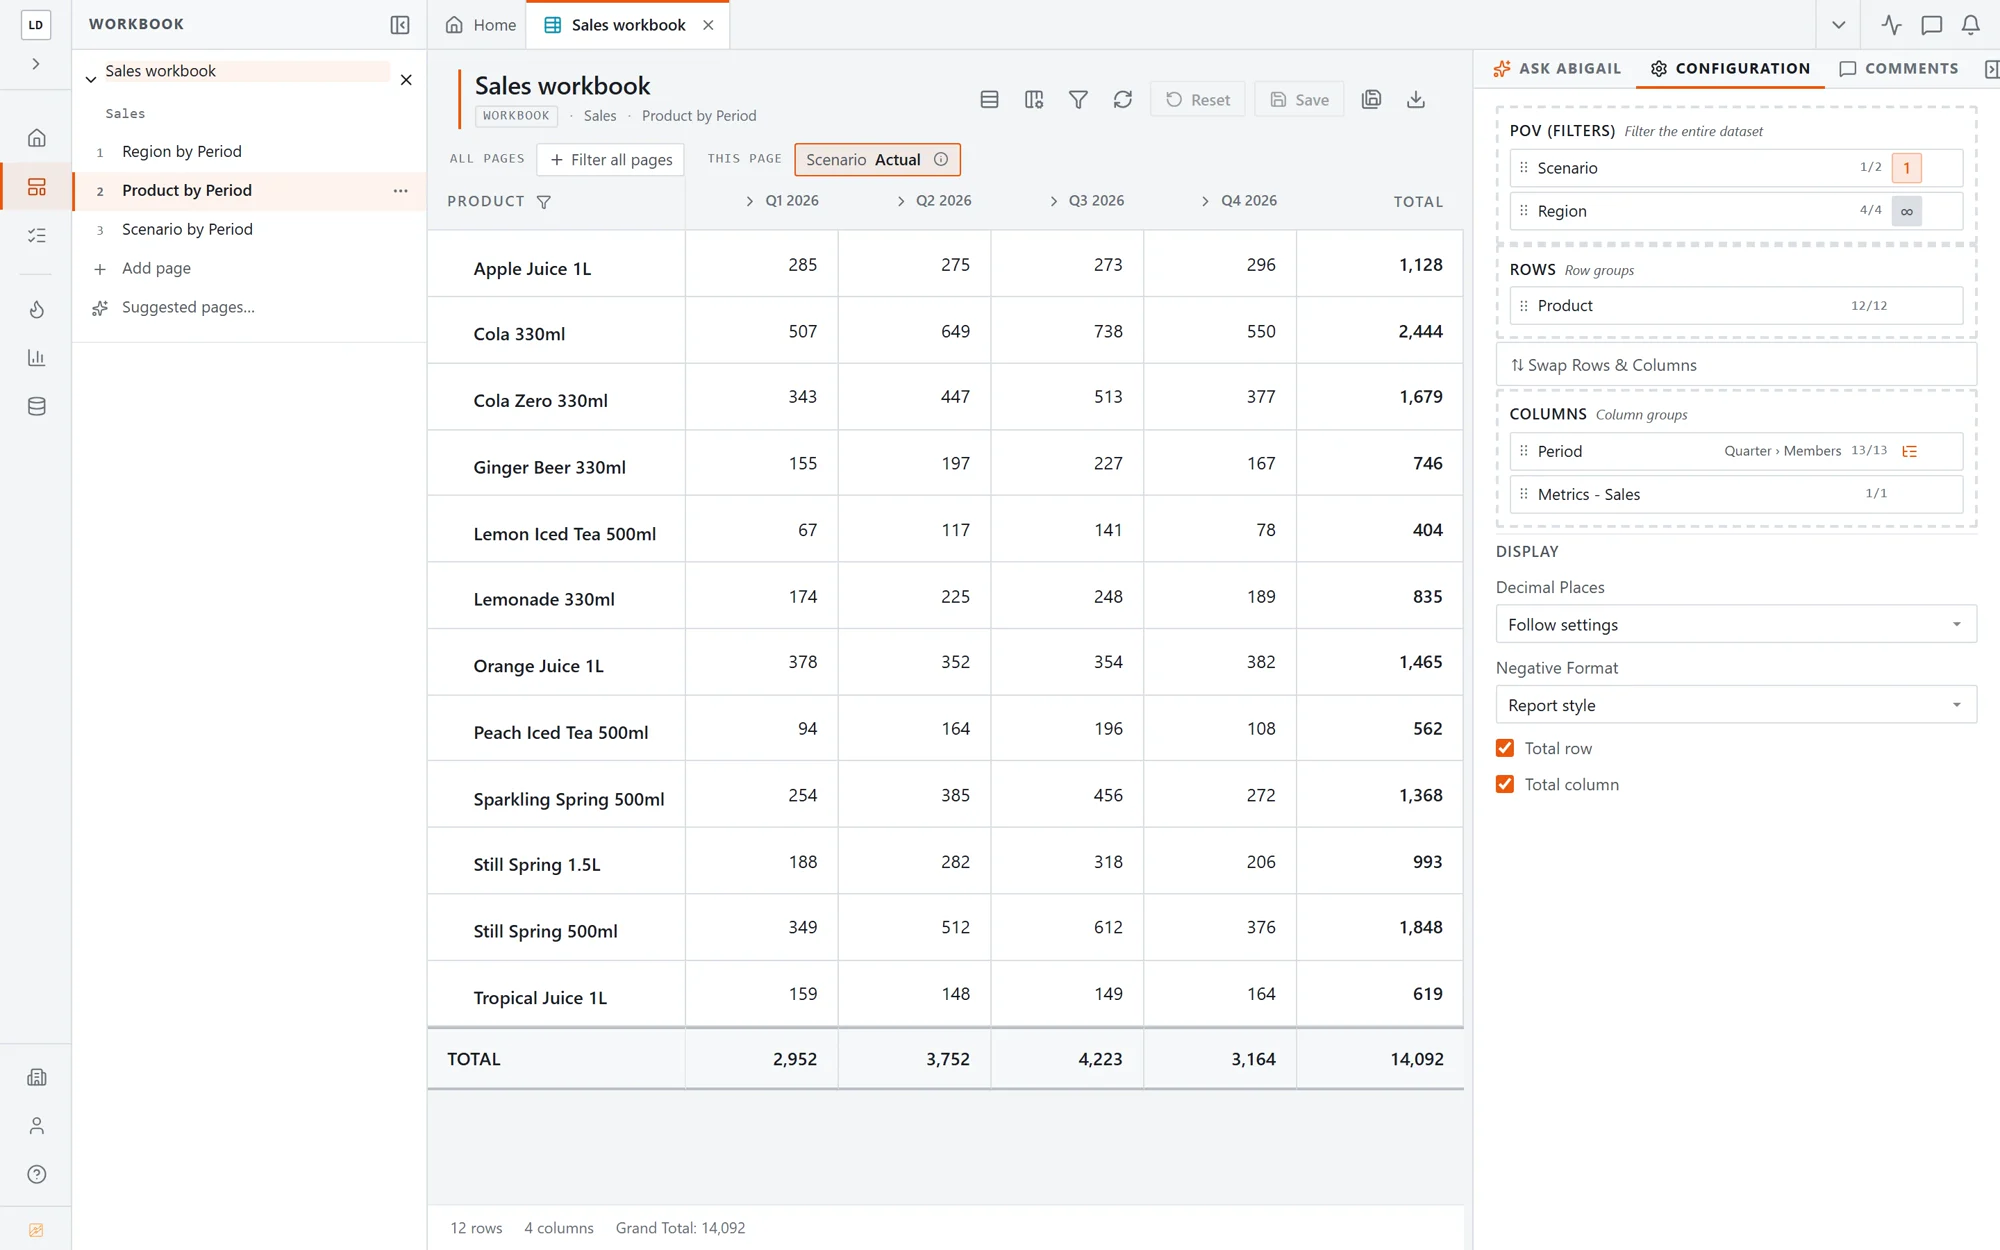
A sales workbook with sheets down the side and a product by quarter table
Workbooks

Many sheets,
one set of data.

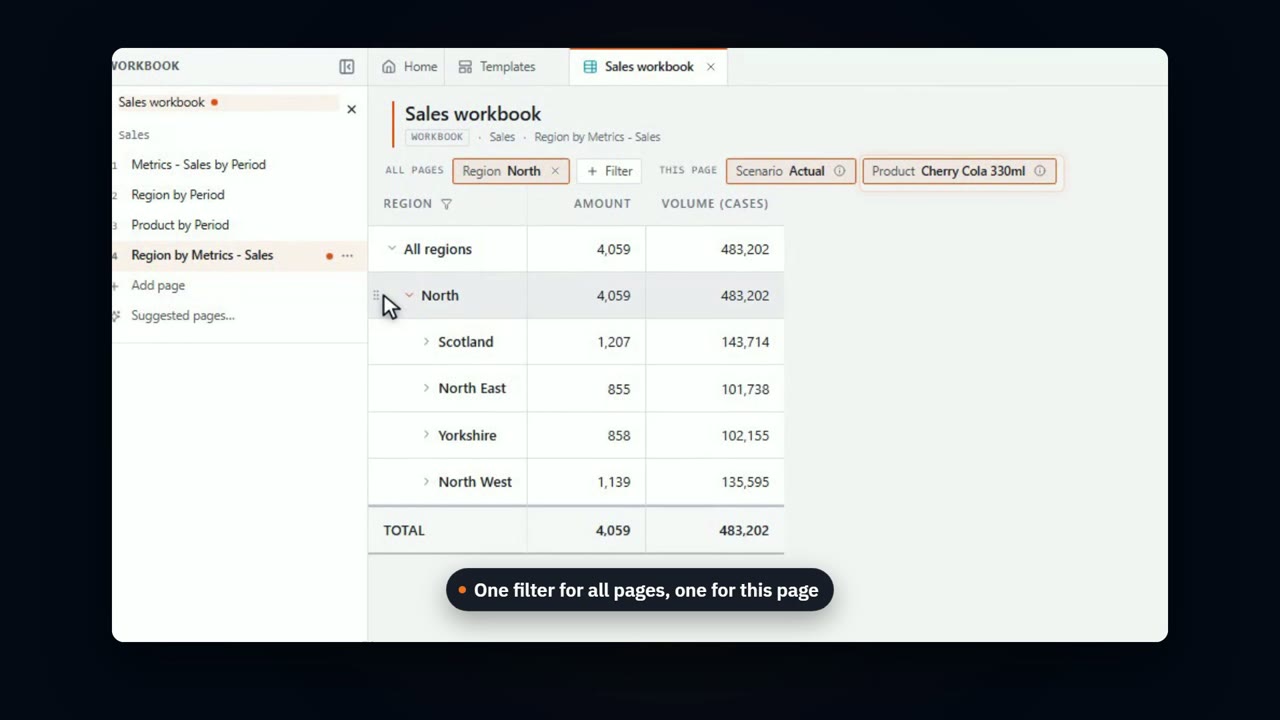
Region by period, product by period, scenario by period: each sheet a view on the same model. Change the filter once, or per sheet.

  • 01Add a sheet in a click, or take a suggested one
  • 02Rows, columns and filters dragged into place
  • 03Totals, decimals and negative formats per sheet
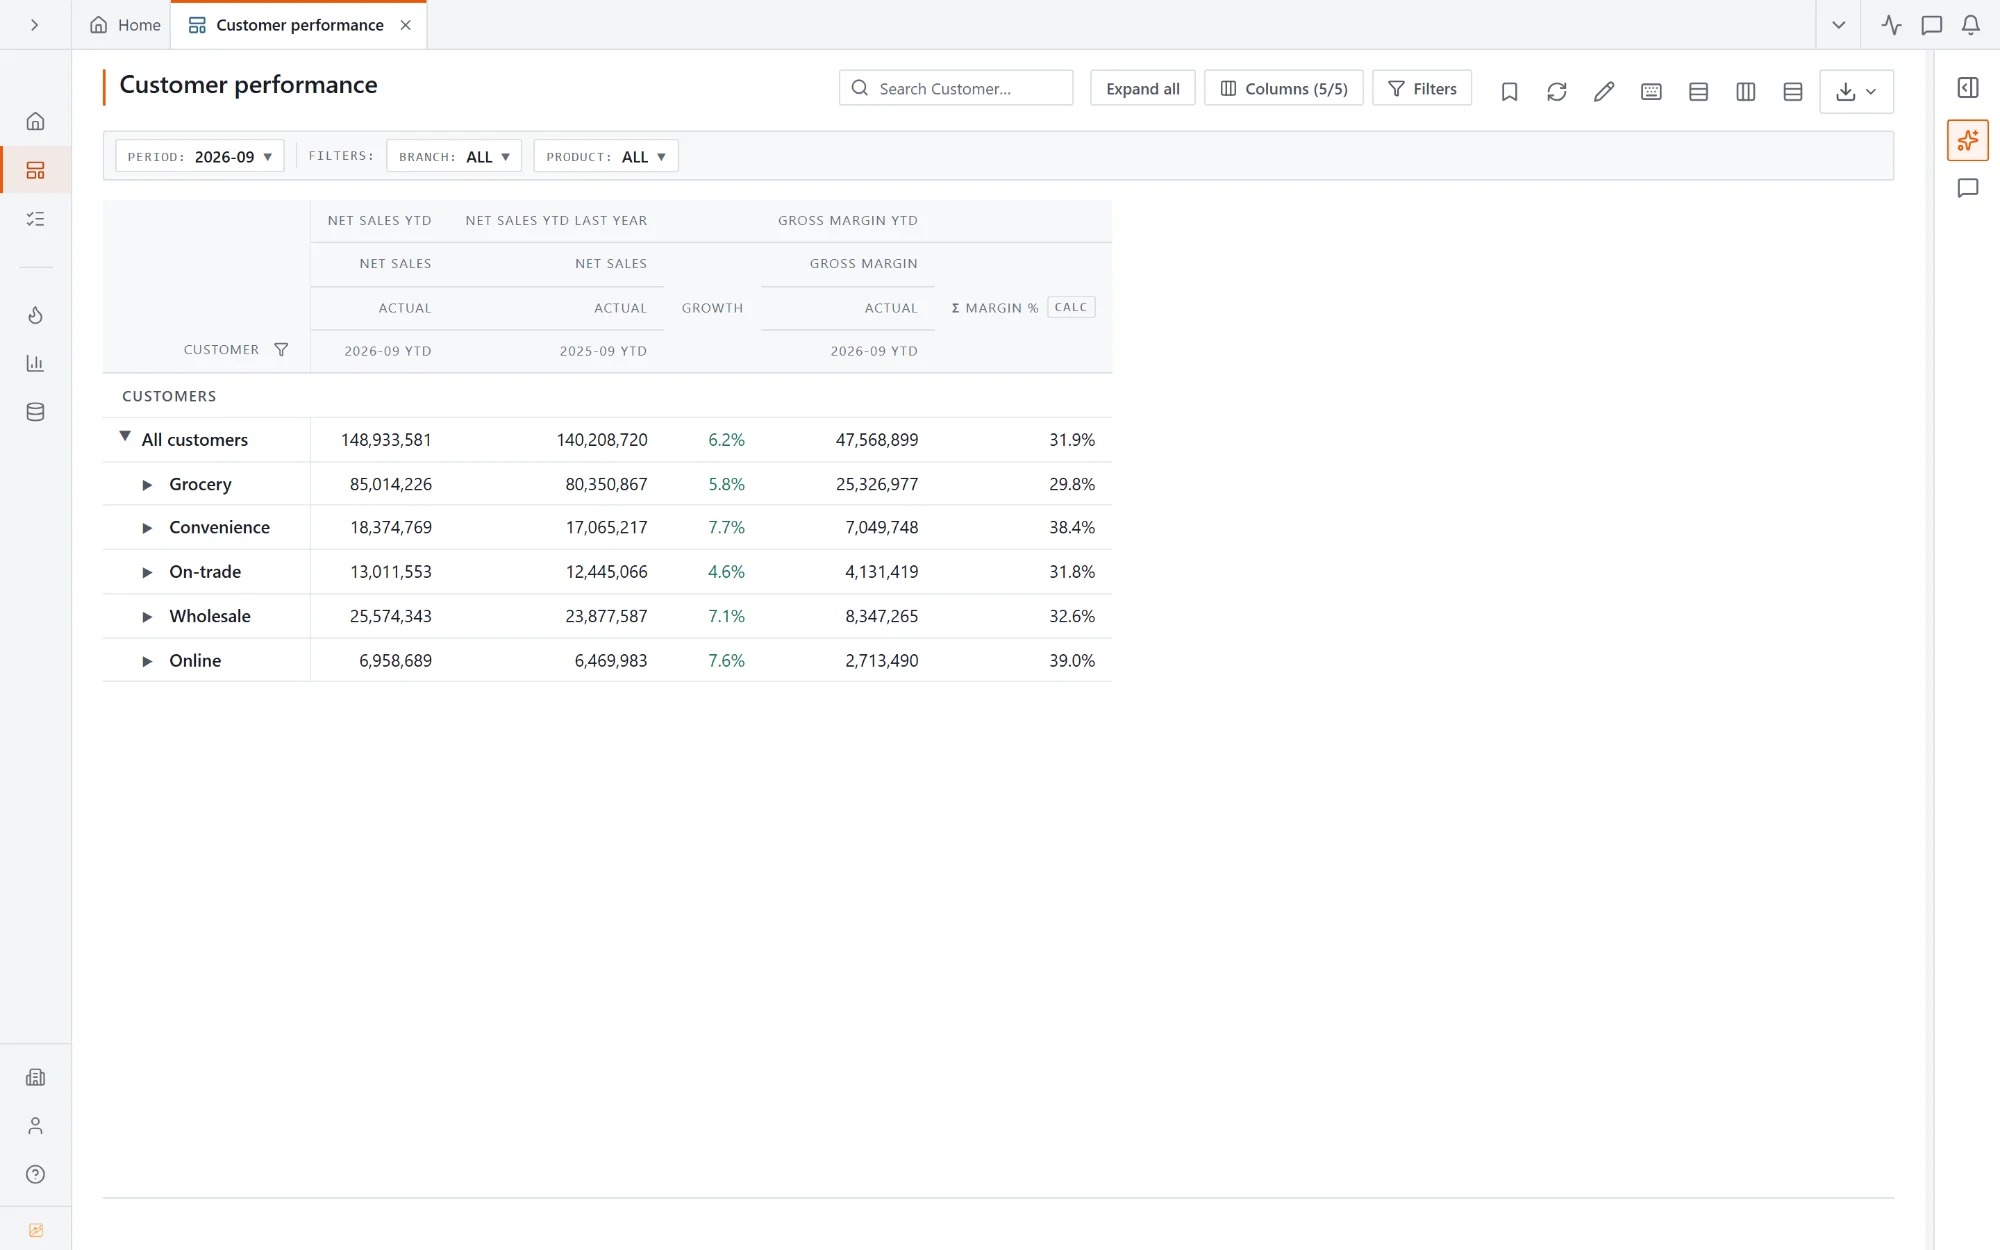
Customer performance report: net sales year to date against last year with growth, gross margin and a calculated margin % by channel
Columns you add yourself

Growth and margin,
without a formula bar.

This year to date against last, a growth column, margin % beside it. Add a column from the model or calculate one in the report, and it works at every level you open.

  • 01Year to date, last year and growth side by side
  • 02Calculated columns such as margin % on any row
  • 03Each channel opens to its customers in a click
  • 04Search, filter and sort without leaving the page
What you get

Everything a month-end report needs.

01

Drill any number

Click down a level and back, Alt-click a whole level, or drill to the rows behind a number.

02

Break it down

Right-click any line and expand it by any dimension: product, customer, branch, account.

03

Workbooks

Several sheets over one set of data. One filter for every sheet, or one per sheet.

04

Calculated lines

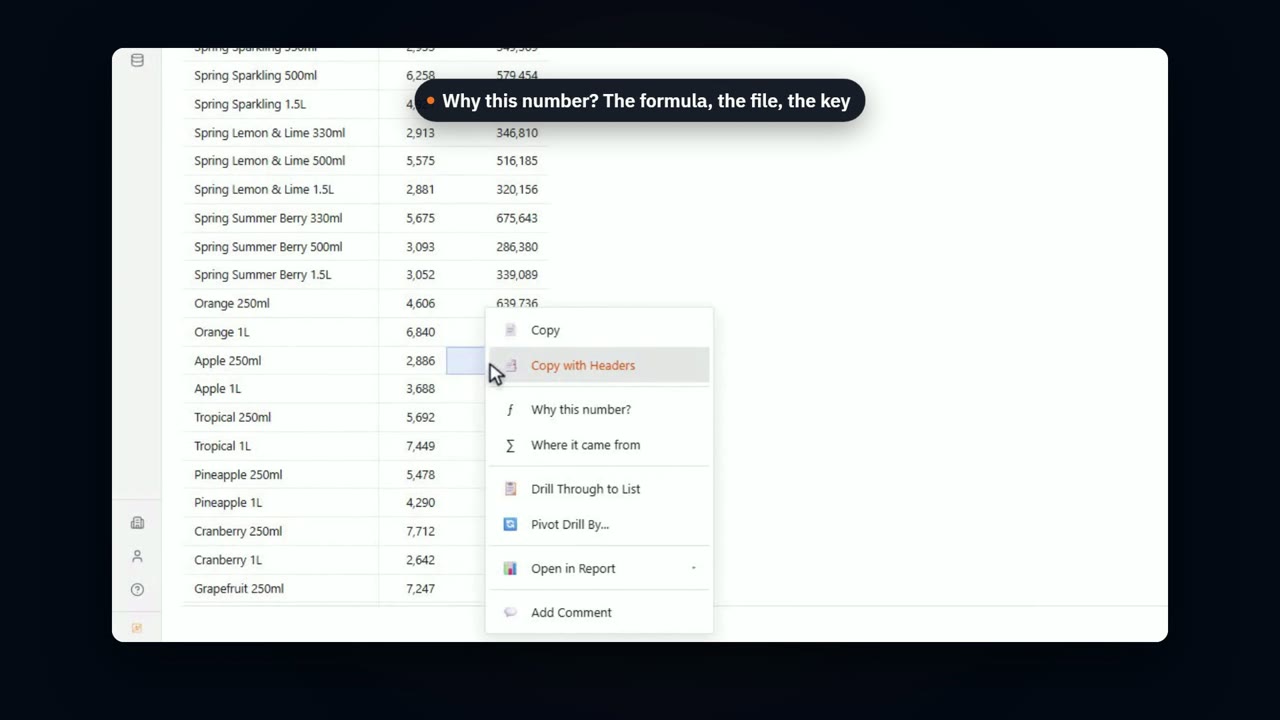
Add a line with a formula or a lookup to a file, right in the report, and see where every number comes from.

05

Pick a month

Period pickers list the months that have data and start on the latest closed one.

06

Excel in one click

Every report exports to a styled .xlsx with its hierarchy and formats intact.

See a report built live.

Book a 30-minute demo, or start free with your latest export.

Book a demo Start free