One place from the raw export to the explained number, and from this year's actuals to next year's budget. Build it once; next month is an upload, not a rebuild.
Files are cleaned in their data sources, load into a forge where flows and calculations run, and come out as reports. Click a layer to see what happens there.
Scroll sideways to see the whole flow →

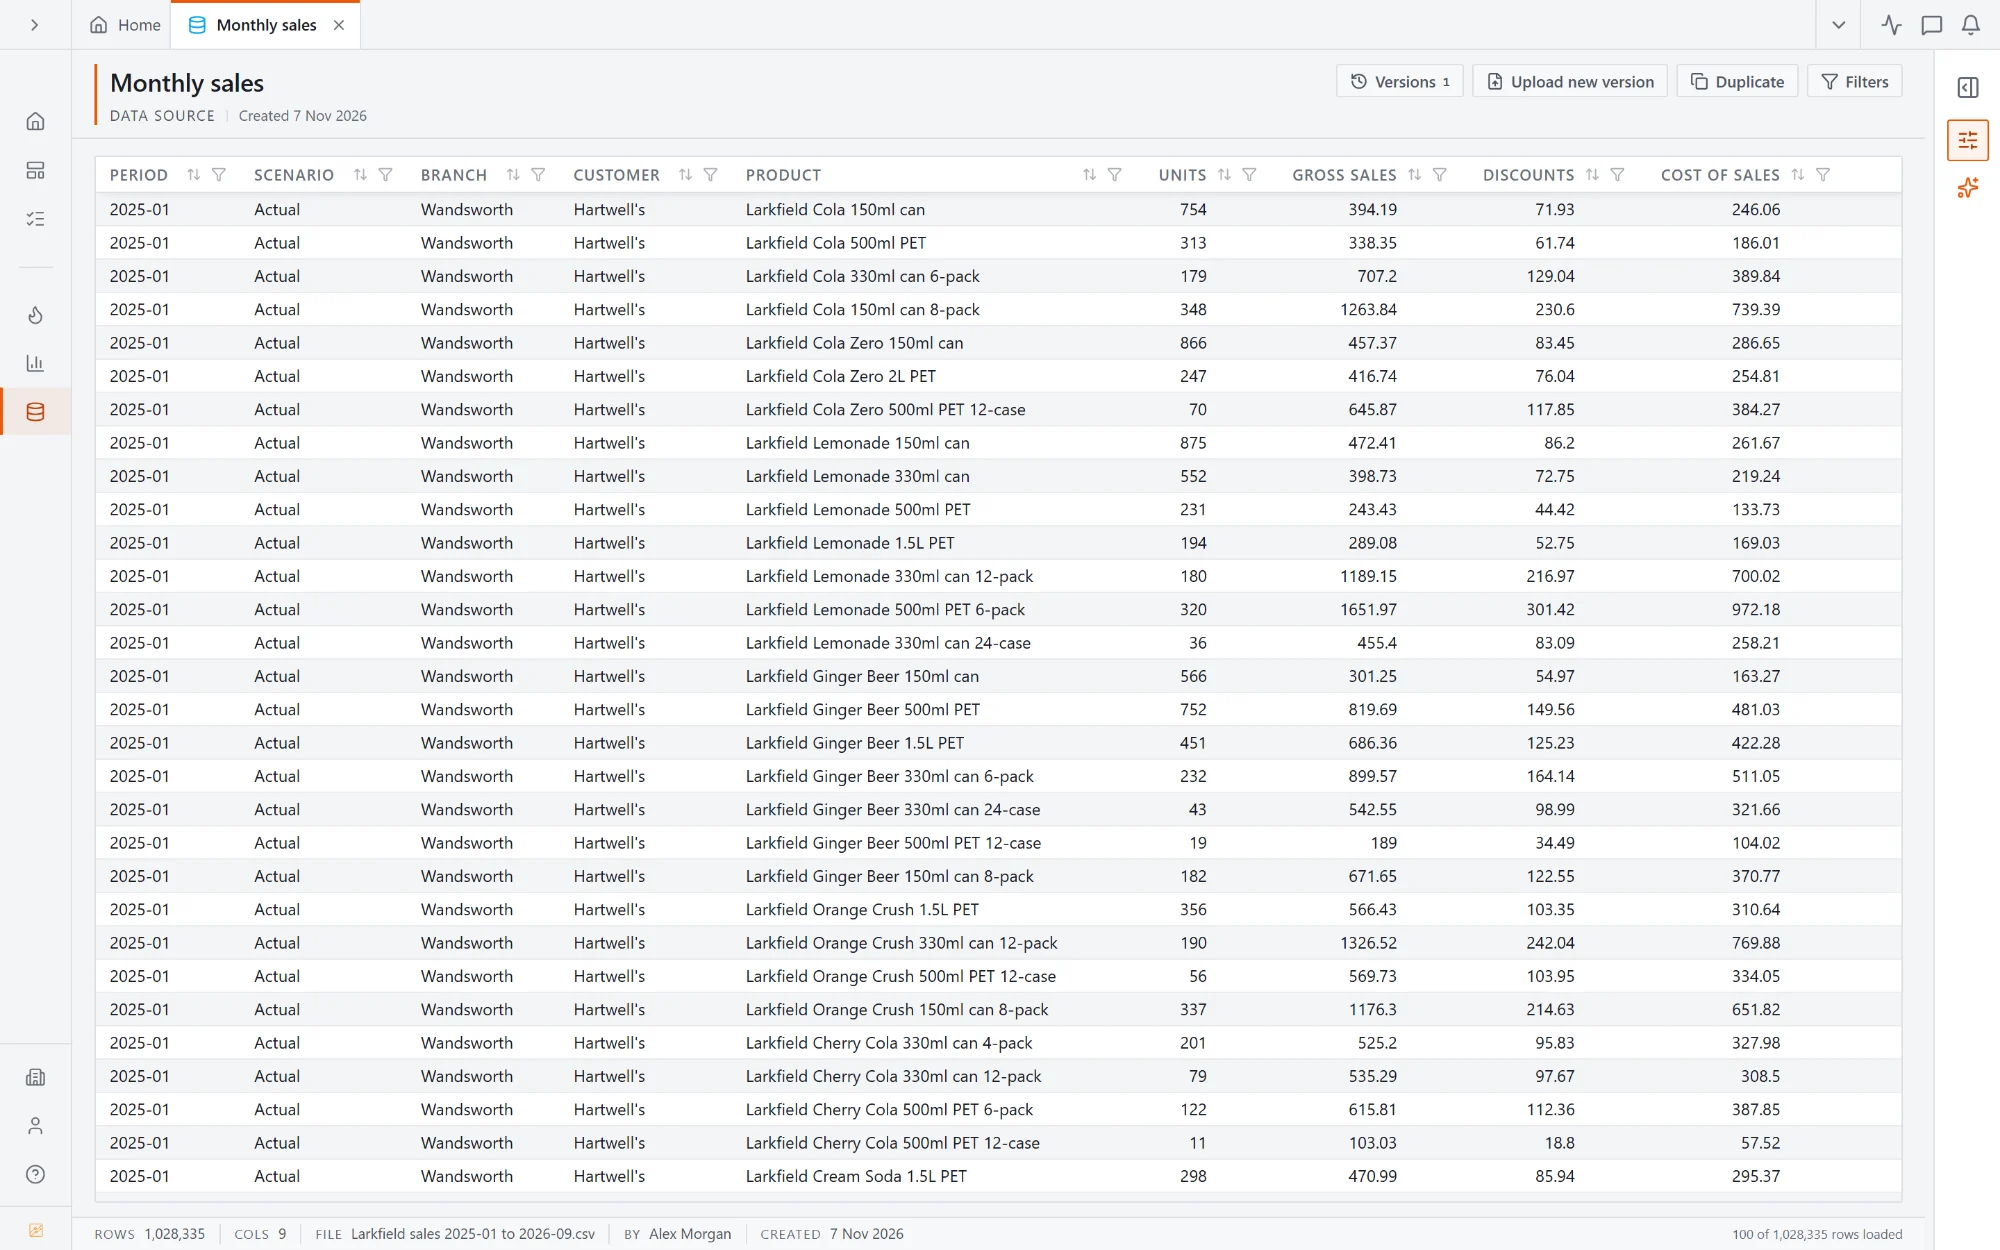
No connectors to babysit and no re-keying. Upload the files you already export today; each one is previewed, kept as a version and checked by its load flow before anything reaches a report.

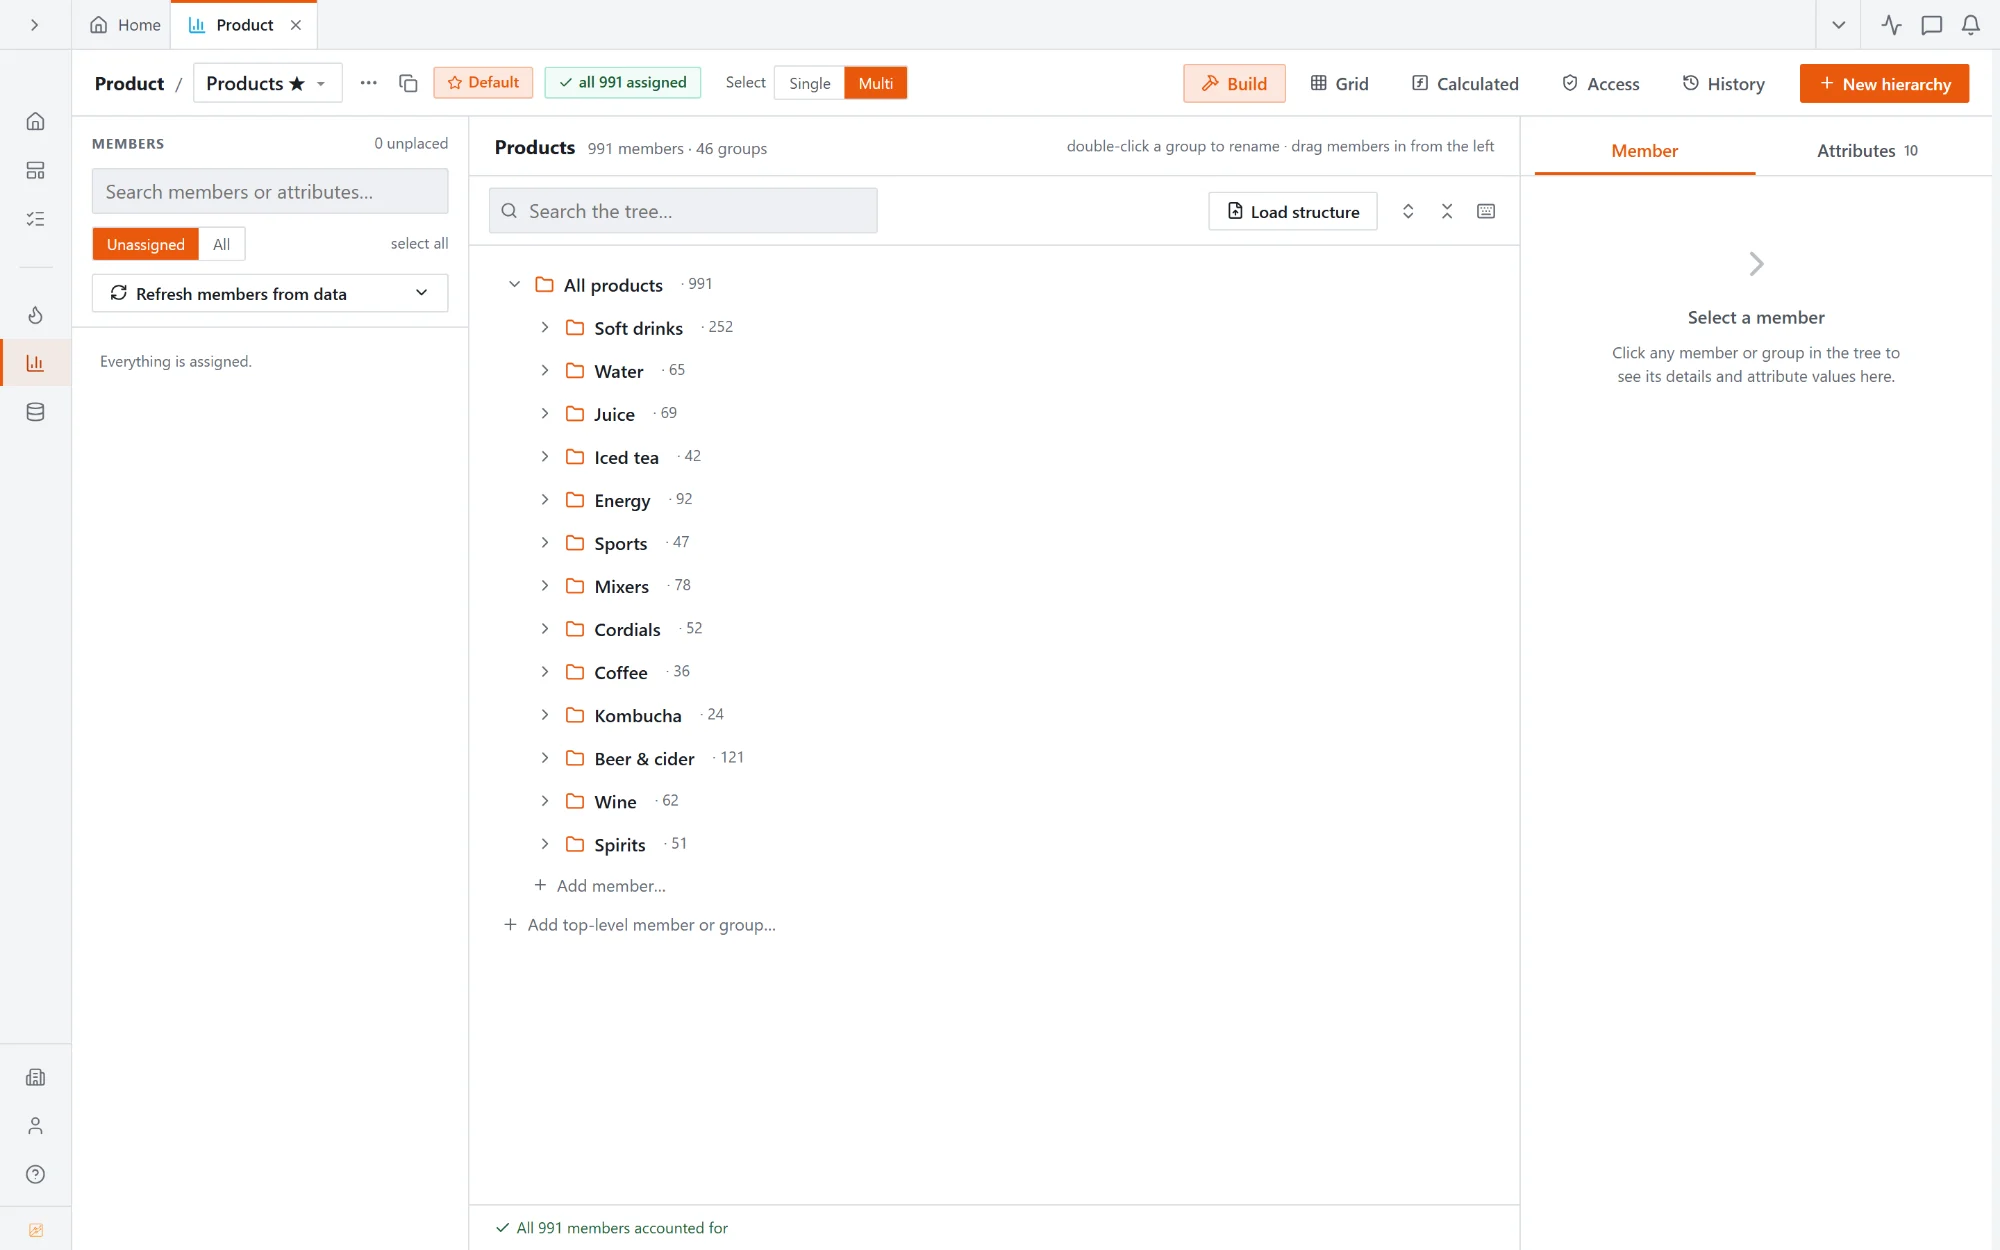
Dimensions, hierarchies and attributes live in one place, so "Region", "Customer" and "Product" mean the same thing in every report and every plan.

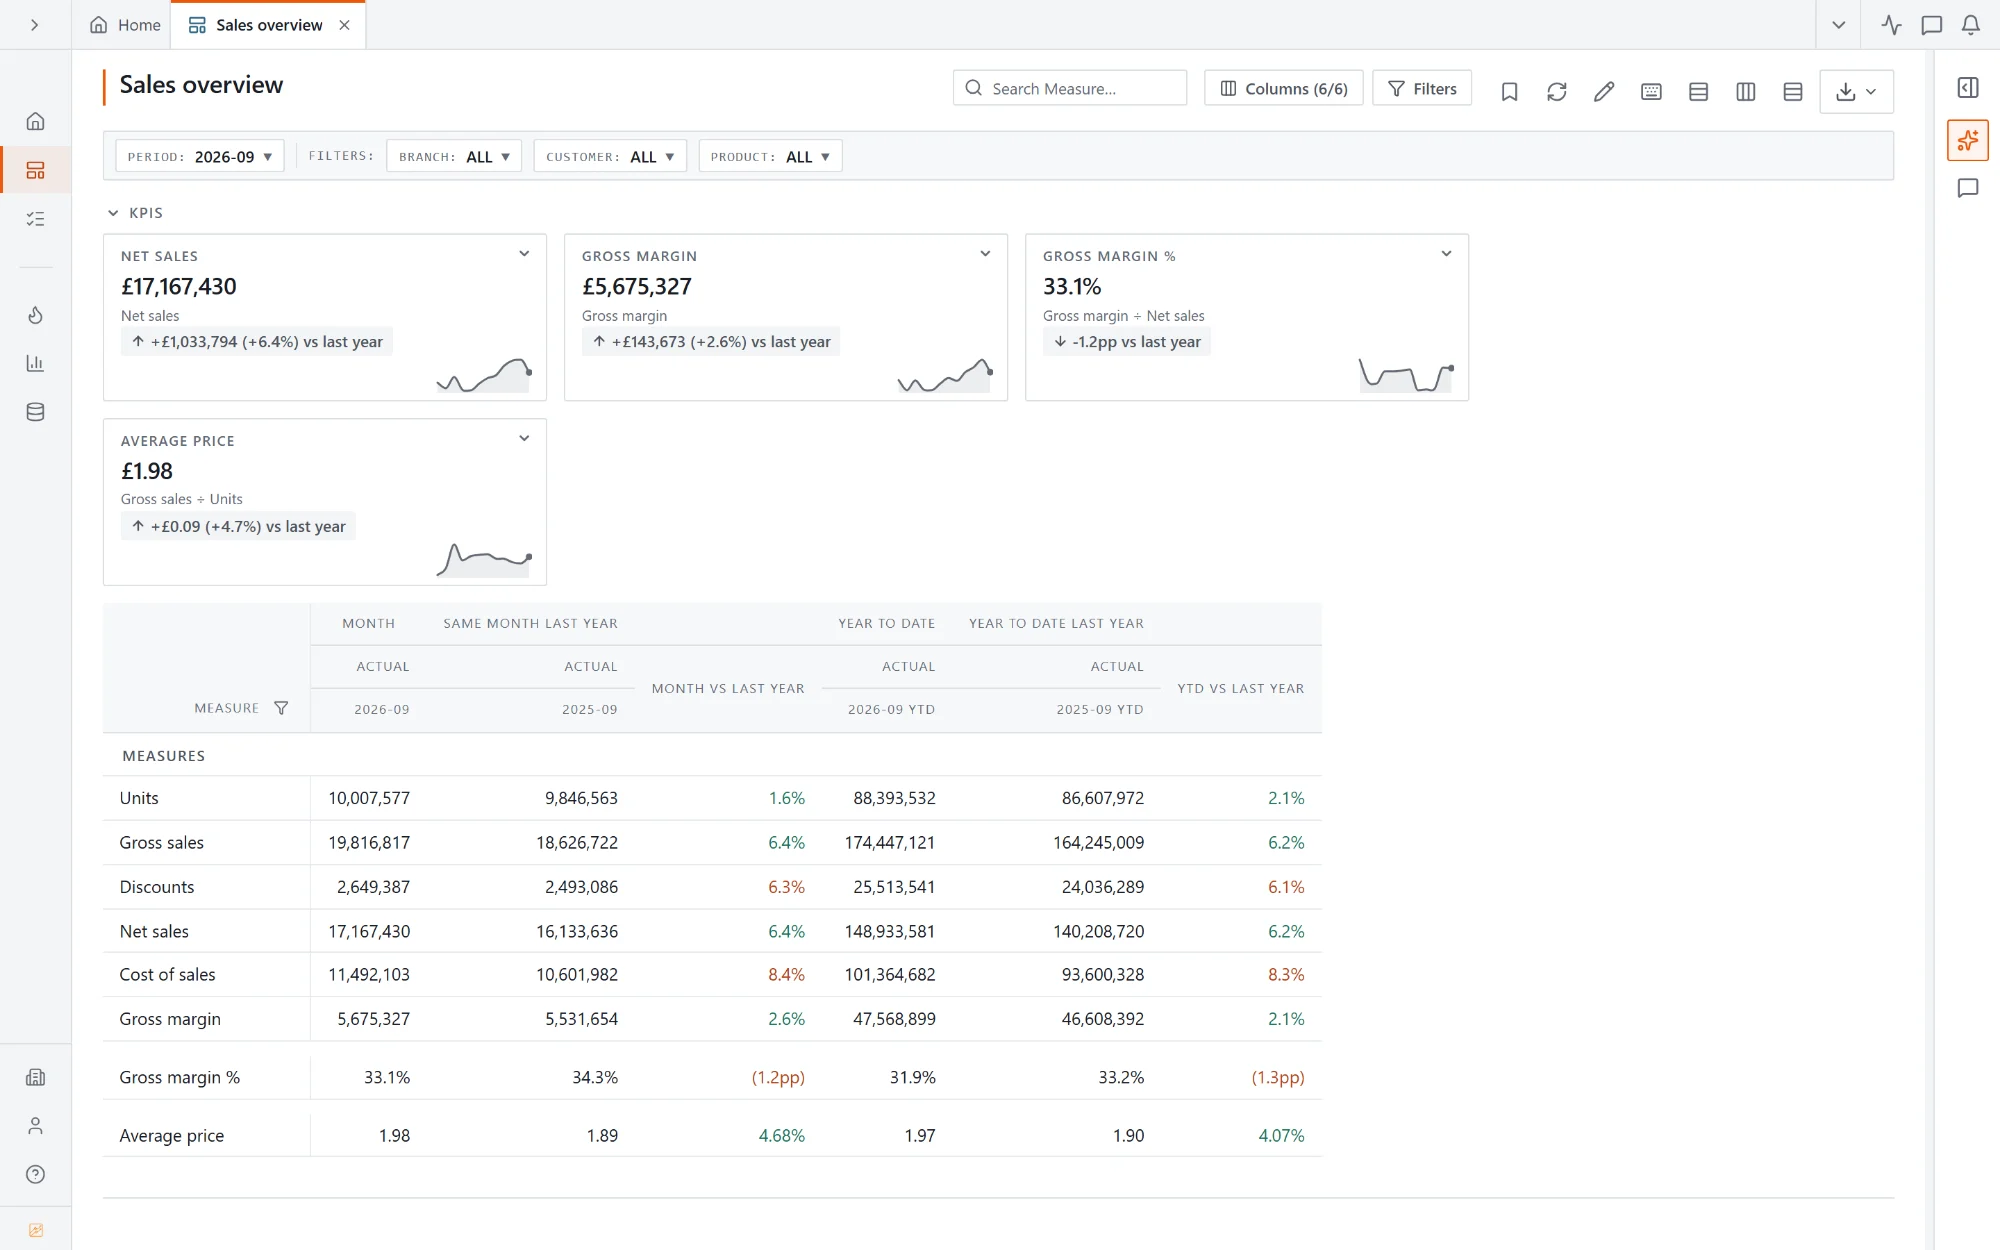
Build the report once: rows, columns, KPI tiles, formats. Every month after that is an upload. And when you'd rather describe a report than build it, Abigail builds it with you.


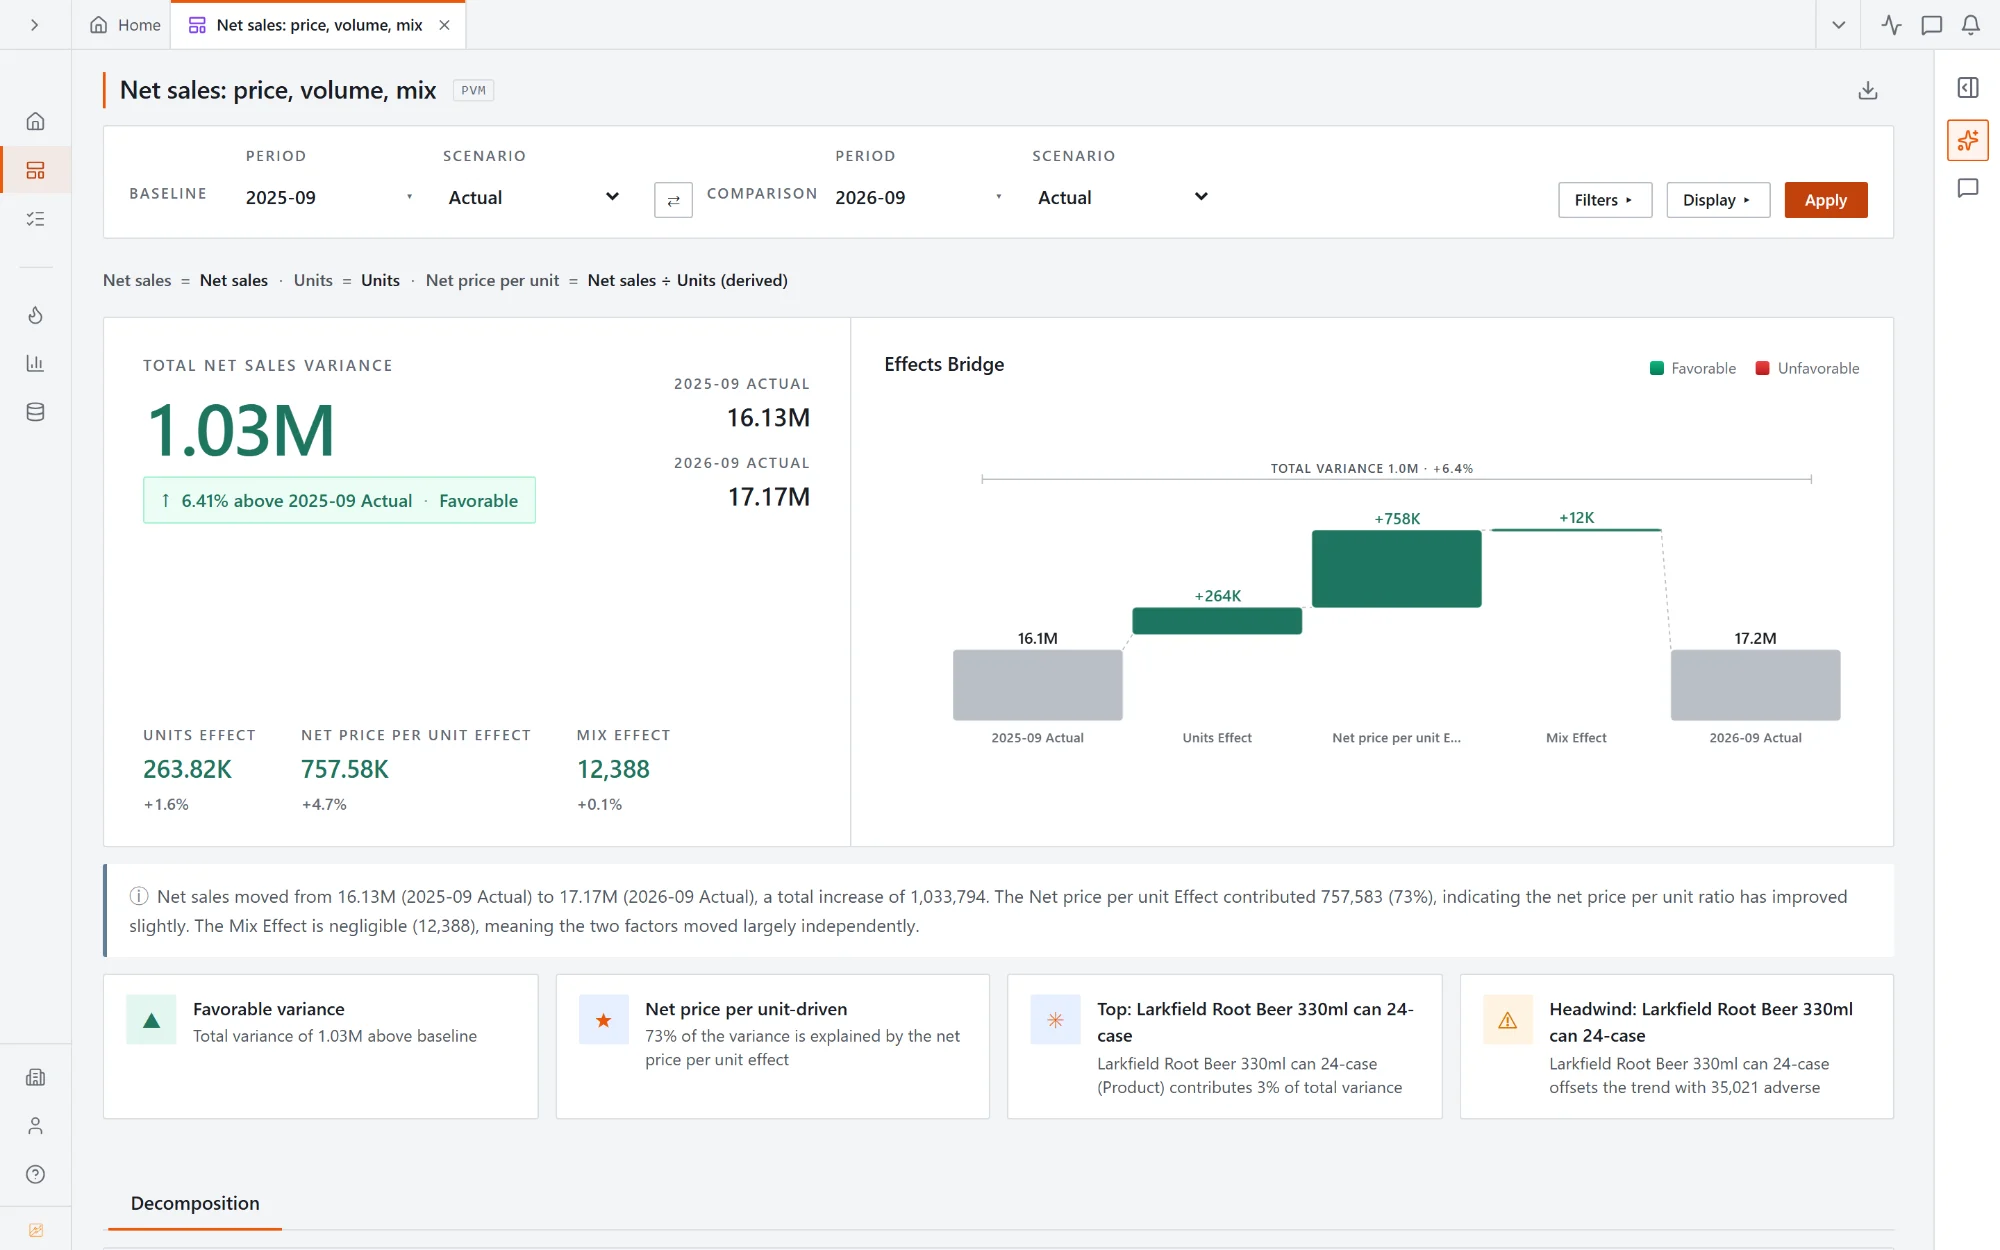
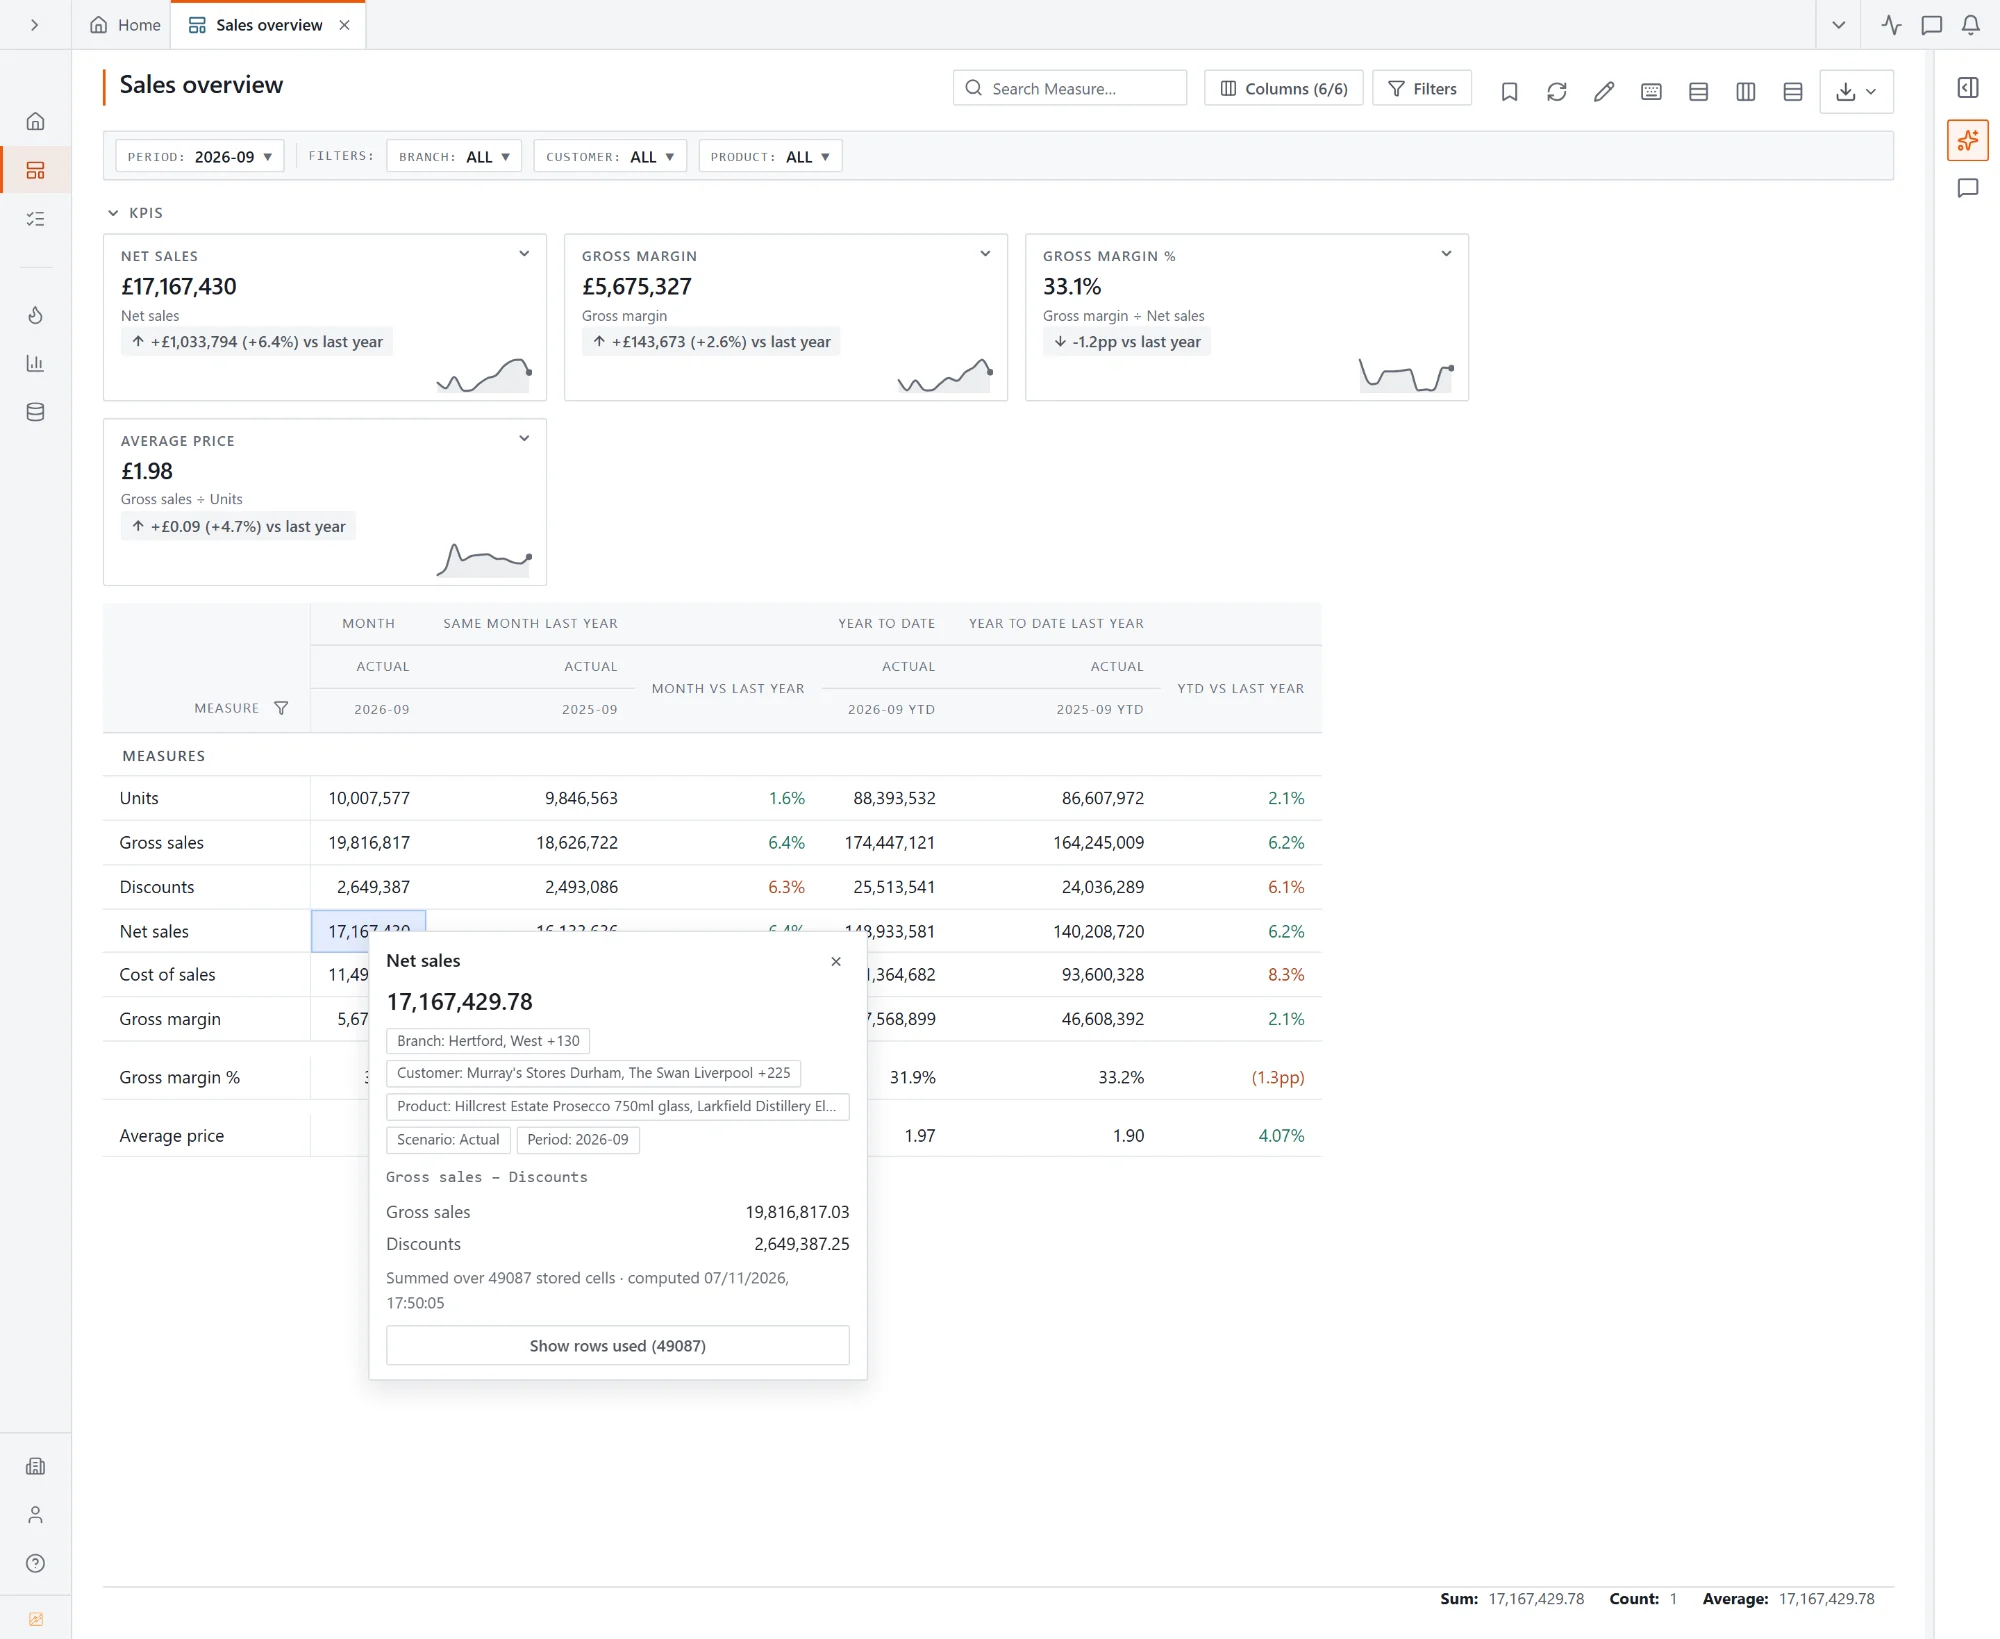
Variance bridges split a movement into price, volume and mix with a written summary. Right-click any calculated figure to see what it adds up, and drill to the rows behind it.


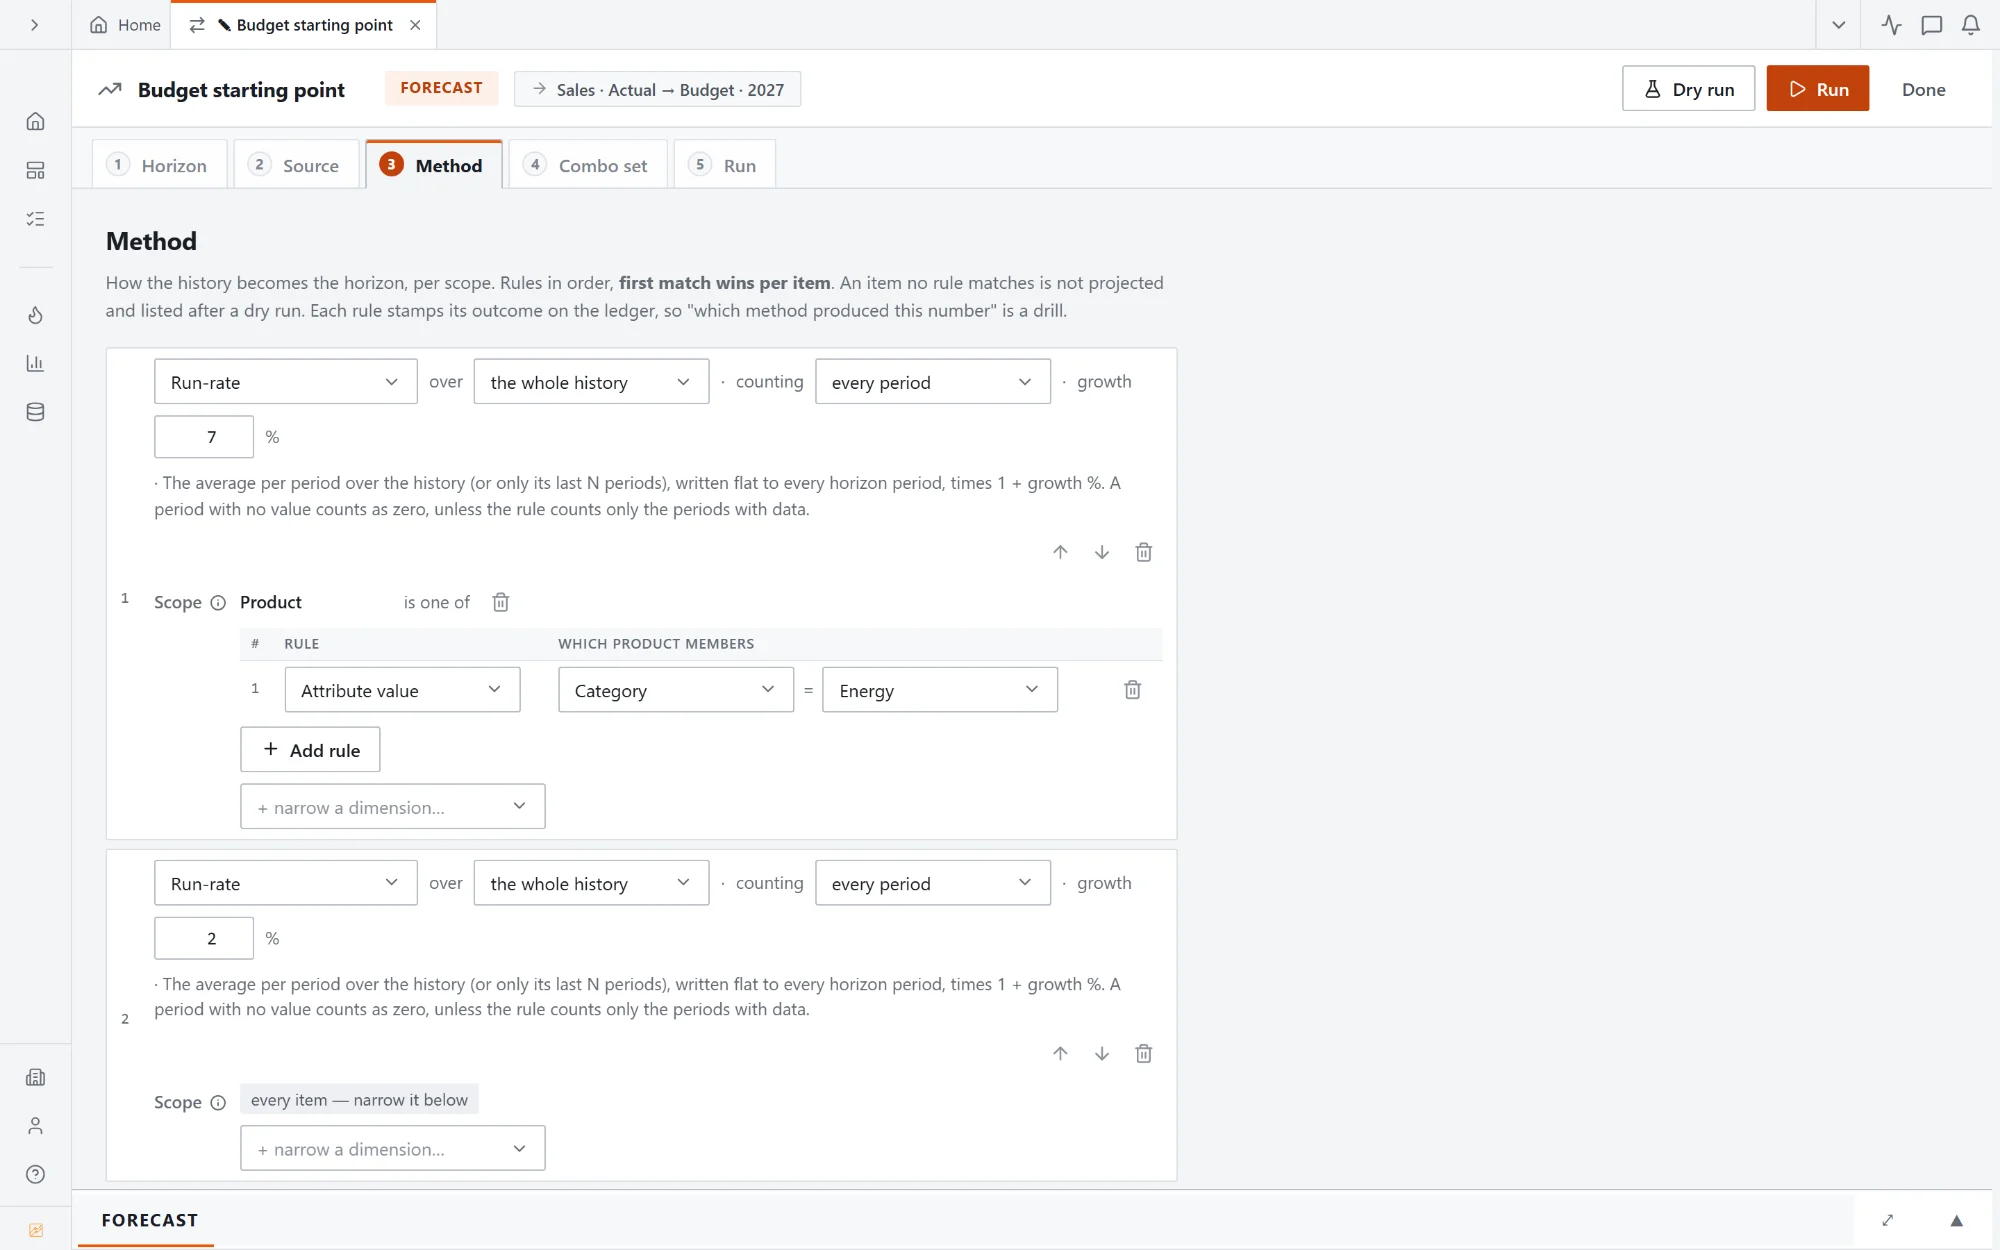
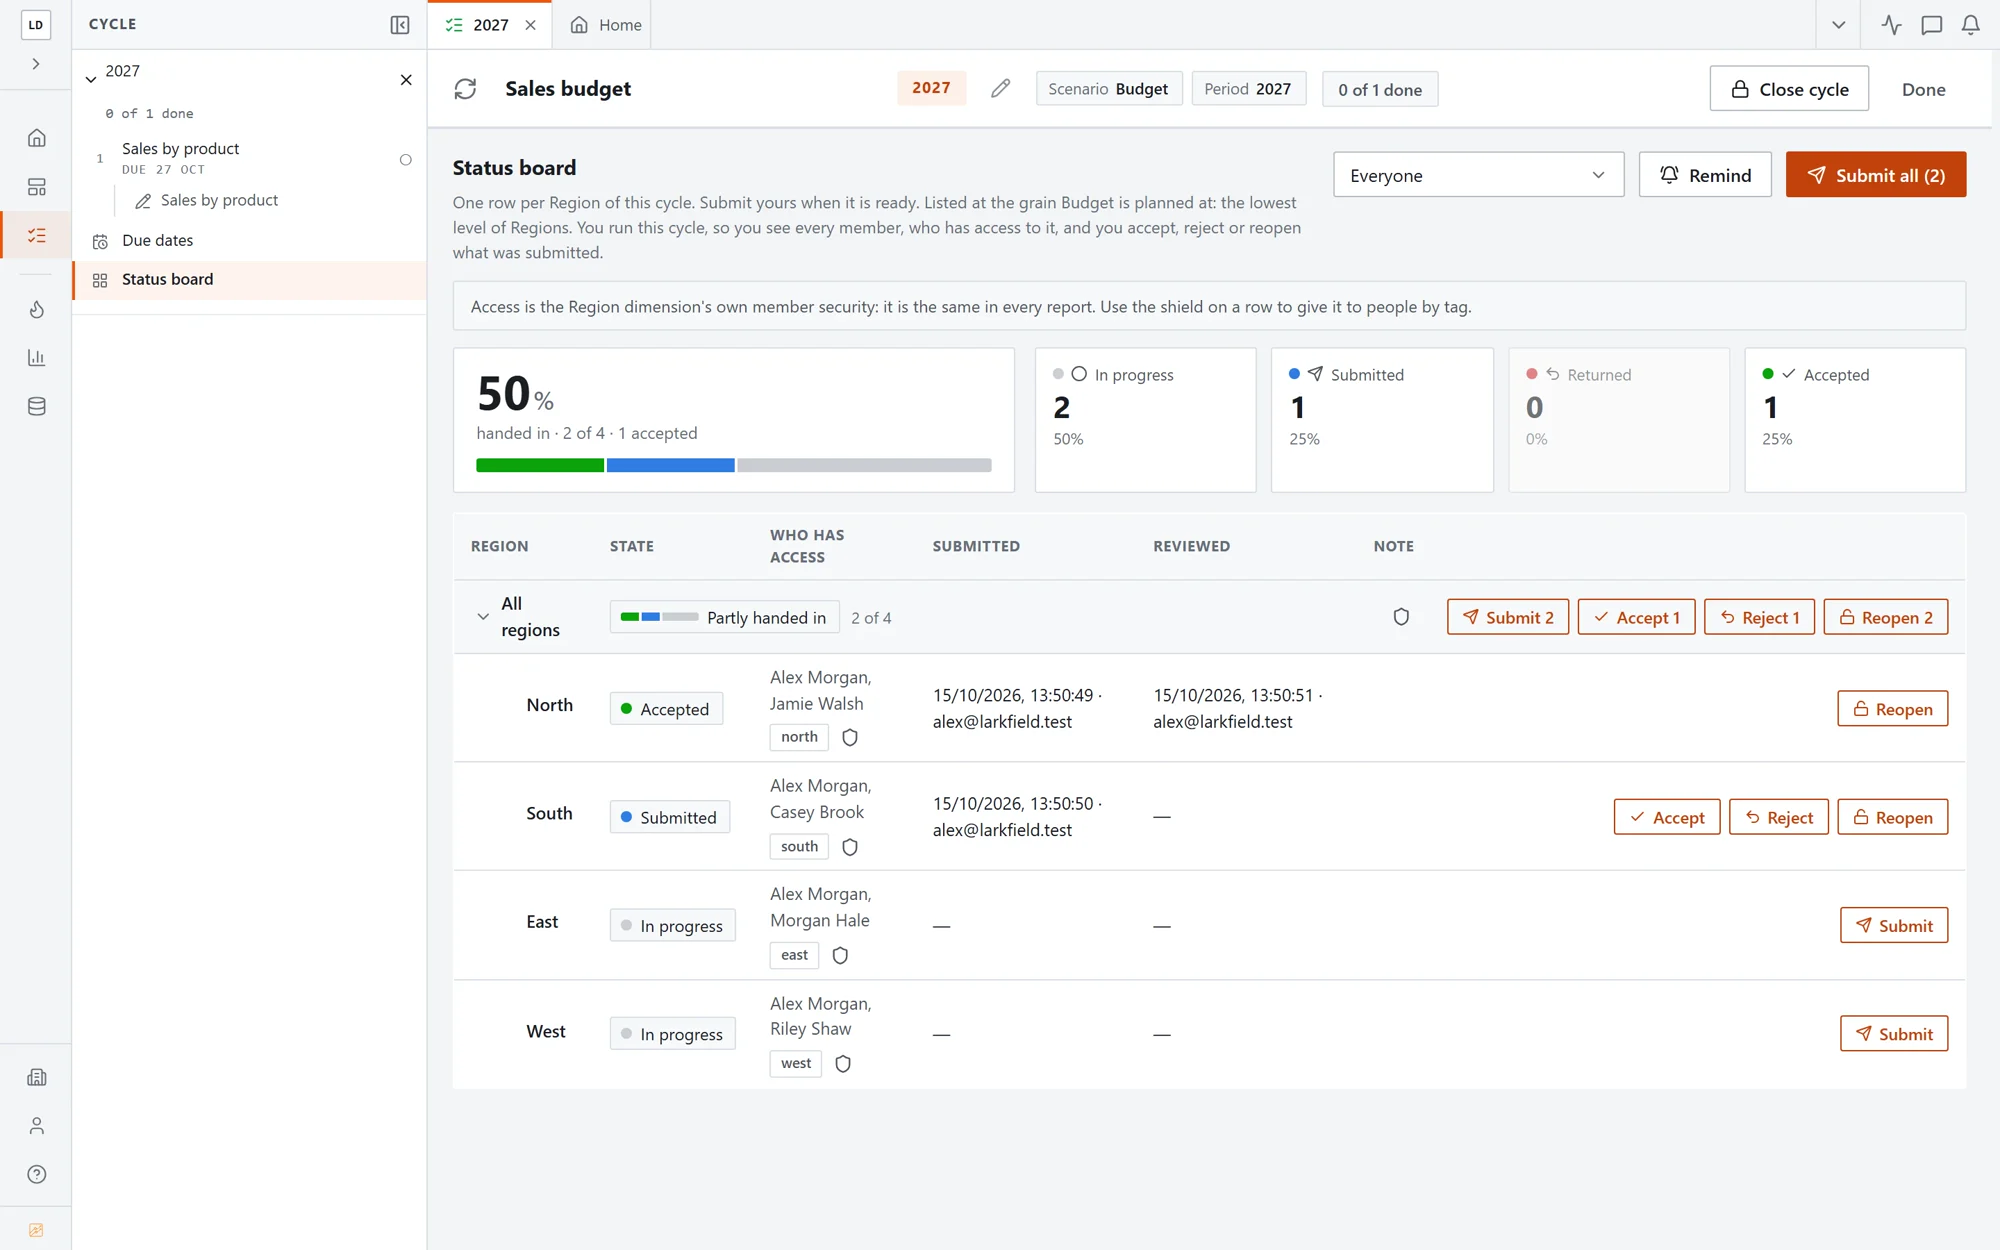
Start the budget from a forecast method, spread it to months and branches, and send it round the budget holders. It lives in the same model as the actuals, so every report shows both.

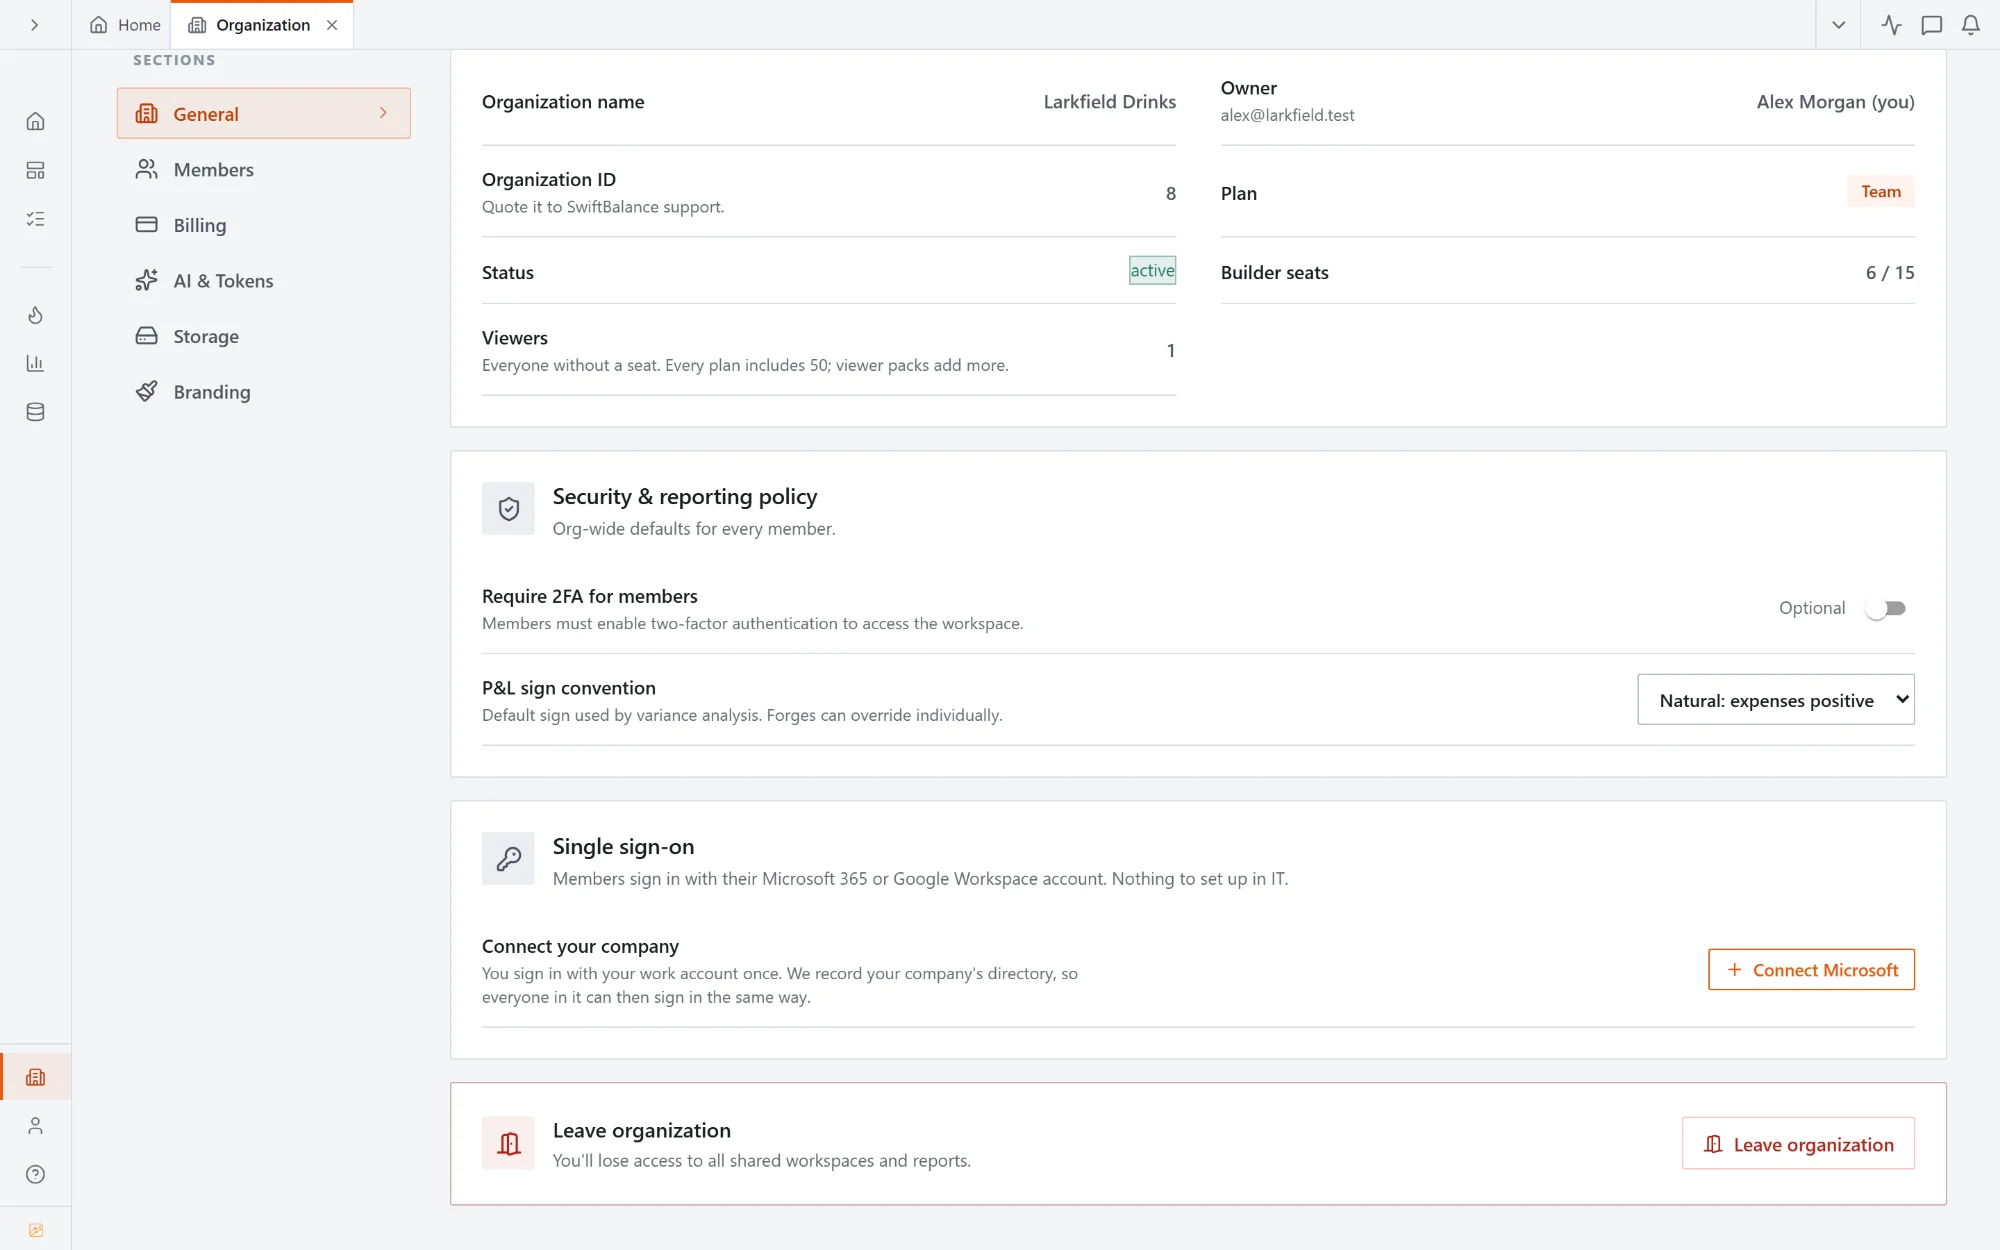
Your team signs in with the work account they already use. The Owner connects the company once; there is nothing for IT to set up.
One live version of the truth, shared on your terms and in your brand.
Drop a CSV or Excel export. Columns, types and periods are detected for you.
Tidy it on the way in: trim spaces, pad codes with zeros, leave out blank rows. The file itself is never changed.
Confirm the dimensions SwiftBalance proposes, shape your hierarchies, set the fiscal calendar.
Build the report, or describe it and let Abigail lay it out. Next month is just another upload.
Book a 30-minute demo, or start free with your latest export.