End-of-year offer Planner for the price of Reporter for two years, set up for you during a free 30-day trial. Ten places, start by 31 January.
Solutions · HR & workforce

Payroll moved.
SwiftBalance tells you who.

"Payroll is up 4% on budget" is not an answer — it's the start of a week of questions. SwiftBalance matches employees period to period, so the movement decomposes into the people behind it: who joined, who left, who moved cost centres, who got a raise.

Start freeSee the platform
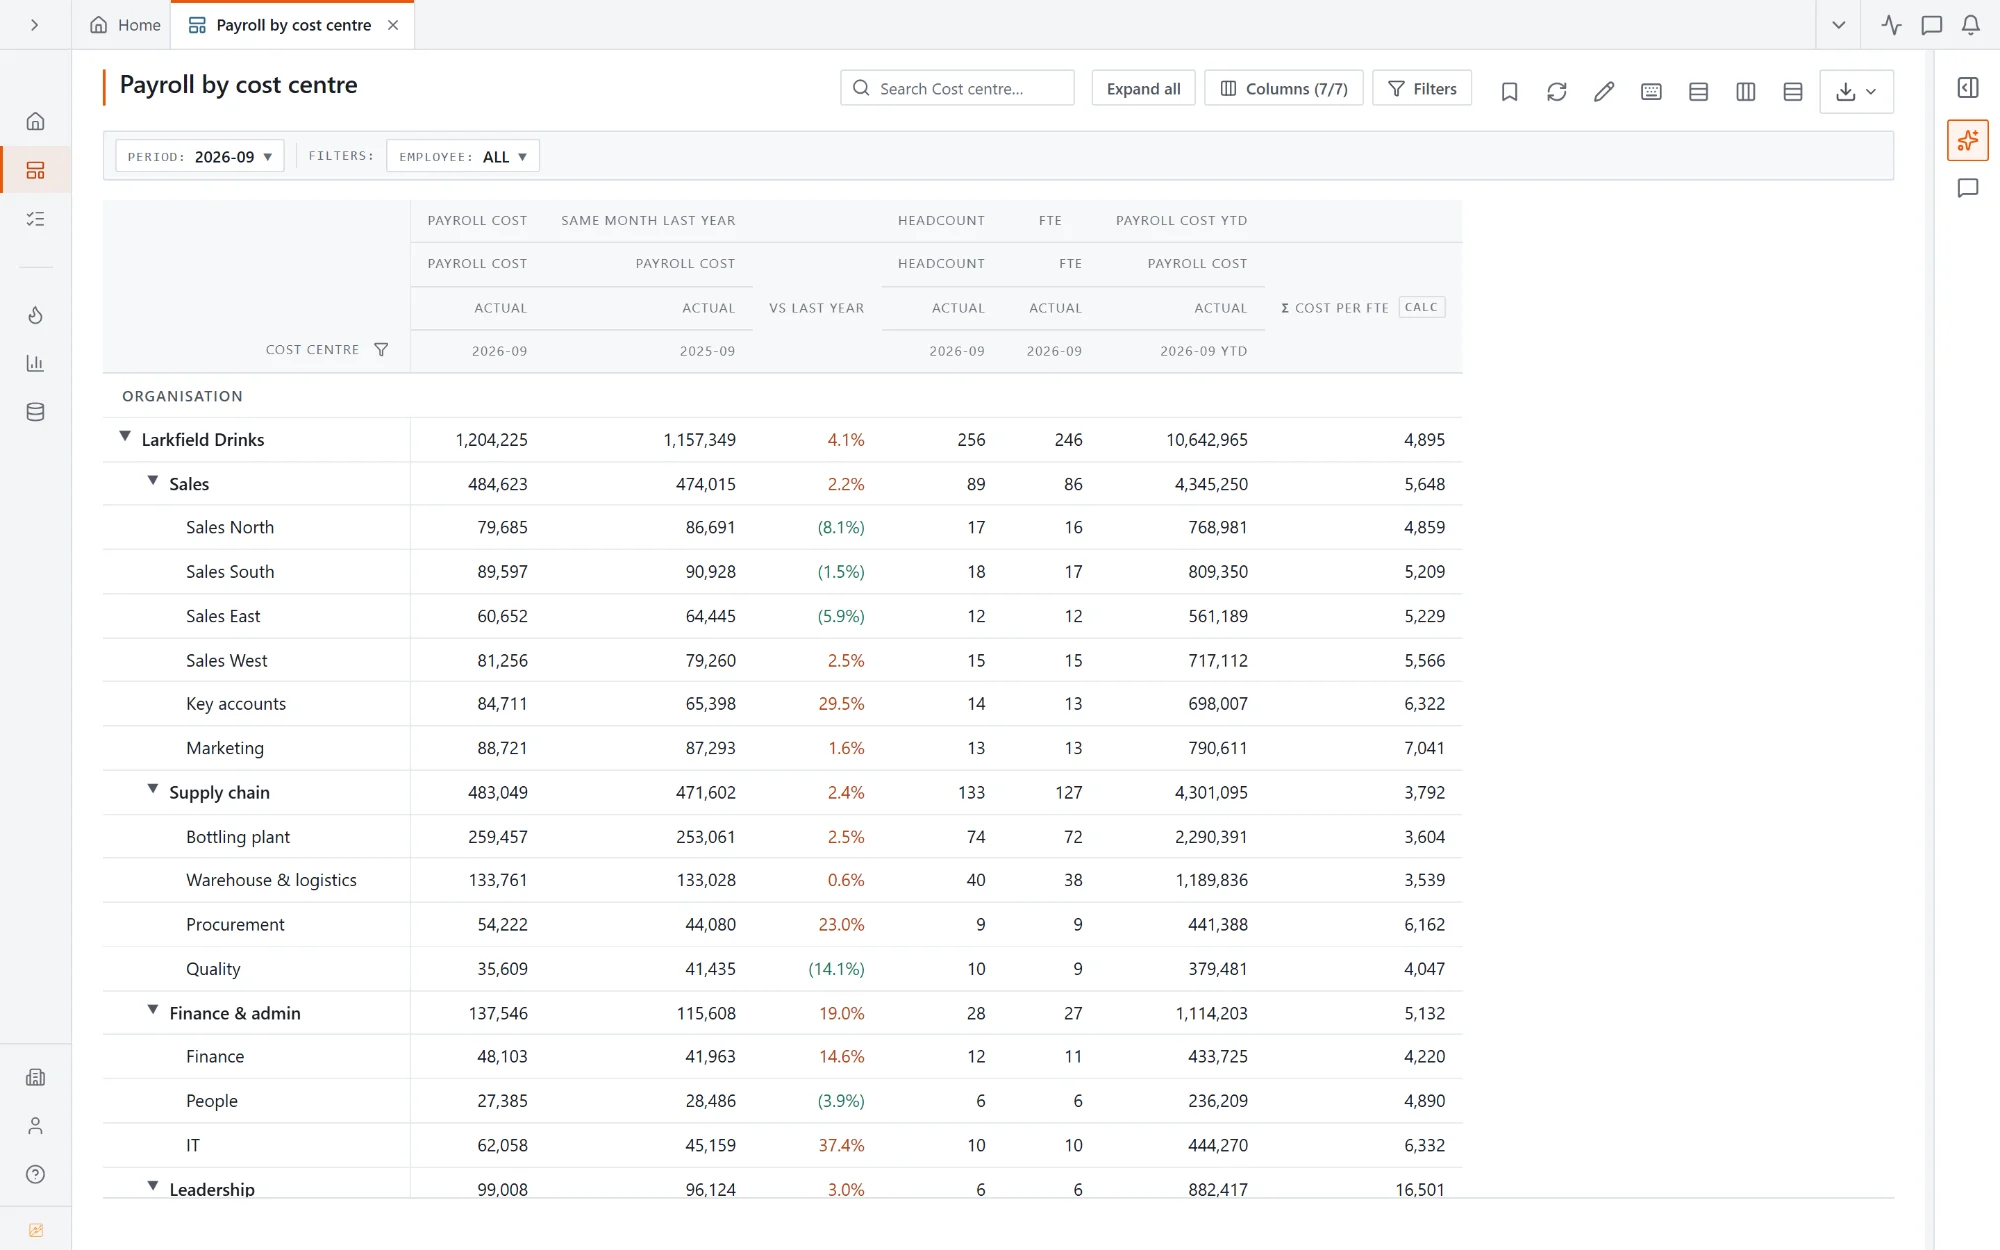
Payroll by cost centre: the month's payroll cost against the same month last year, headcount, FTE, the year to date and cost per FTE, by function and cost centre
The report

Headcount and cost,
by any cut of the org.

One payroll model feeds every view: cost, headcount and FTE by cost centre, rolled up through the functions, with the month against last year and the year to date. Load next month's payroll file and every column moves on.

  • 01Payroll cost, headcount and FTE in one model
  • 02Cost per FTE as a calculated column, on every row
  • 03Break down by cost centre, grade, location: any attribute on the employee
  • 04Export to Excel, or put it in the monthly report book
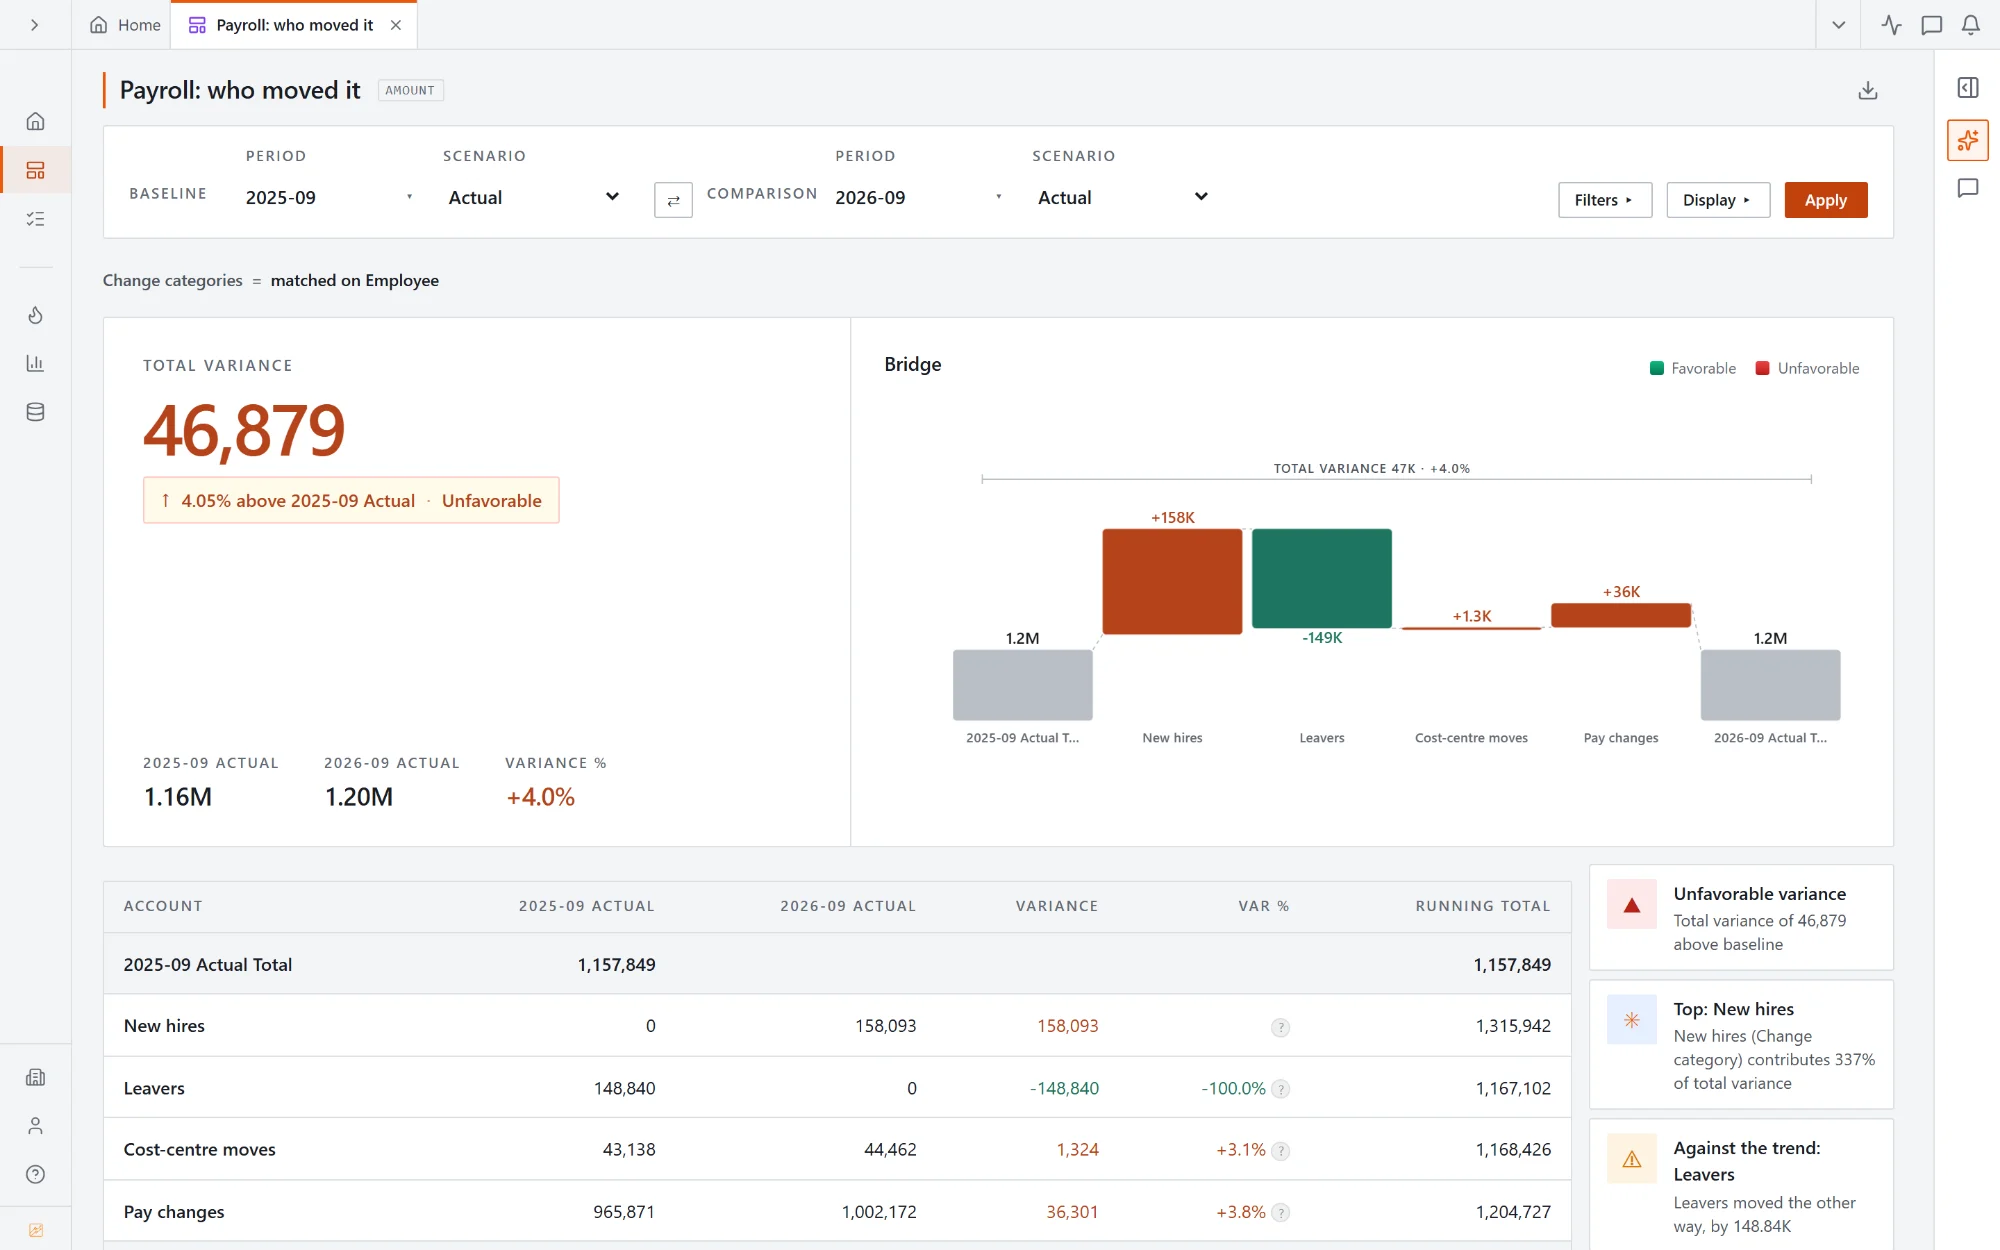
Payroll bridge between September last year and this year, matched on employee: new hires, leavers, cost-centre moves and pay changes
The why

A bridge that
names names.

A standard variance tells you which cost centre moved. The payroll bridge matches each employee across the two periods and puts the whole movement on what happened: new hires, leavers, cost-centre moves and pay changes.

  • 01Employee-level matching between any two periods
  • 02The movement split into new hires, leavers, cost-centre moves and pay changes
  • 03Drill from any bridge bar to the individuals behind it
  • 04Member-level security keeps sensitive rows on a need-to-know basis

Same data, more answers

The payroll model you build for the monthly report answers the next questions too.

Who is behind a number Drill from a cost centre's total to the people in it, and to the rows they came from.
Any cut of the workforce Grade, location, hire date: every attribute on the employee record is a way to break the numbers down.
Notes that stay put Pin the explanation to the cost centre and month it is about, and it is there when the next payroll lands.
How it works

From payroll extract to explained movement in three moves.

01

Upload

Drop the payroll register or HR export — one row per employee per period is all the bridge needs.

→ payroll_september.csv
✓ 256 people
✓ periods detected
02

Model

Confirm the dimensions (cost centre, grade, location) and pick the employee as the matching key.

[DIM] Cost centre · 14
[KEY] Employee
✓ functions rolled up
03

Explain

Open the bridge between any two periods. Every pound of movement lands on a hire, a leaver, a move or a pay change.

Sep vs Sep · +47K
new hires +158K · pay +36K
leavers -149K · ✓ ties

Common questions

What data does the bridge need?

A payroll or HR extract with an employee identifier, a period, a cost amount, and the attributes you want to cut by. If an employee appears in both periods it's a stayer; the bridge classifies everything else from the data.

Does the movement actually reconcile?

Yes. New hires, leavers, cost-centre moves and pay changes add up to the total movement, every time: anything no rule claims lands in its own line. If the payroll ties to the ledger, so does the bridge.

Is employee-level data safe in a reporting tool?

Access is controlled at dimension-member level — a manager can be limited to their own cost centres, and drill-through respects the same rules. Plus roles, 2FA and an organization audit log.

Can it handle weekly and monthly payroll together?

Yes. Load the payroll by pay date and the model keeps days, so weekly-paid and monthly-paid people add up correctly in the same monthly report.

Stop reconciling headcount
by hand.

Start free with a payroll extract, or book a 30-minute demo.

Start free Book a demo